The most striking number in the 2024 SPIVA Scorecard is not the one most people cite. Over the 15-year period ending December 2024, not a single U.S. equity fund category had a majority of active managers outperforming their benchmarks. Zero categories out of 22. That result holds after accounting for funds that merged or liquidated during the period, a methodological choice that makes the SPIVA data considerably more reliable than studies that only track surviving funds. But the 2024 report also produced a result that caught the industry off guard: active small-cap managers posted their best year in more than two decades of SPIVA tracking, with only 30% underperforming the S&P SmallCap 600. Understanding both results, and why they do not contradict each other, is where the real analytical value lives.
The SPIVA U.S. Scorecard, published semi-annually by S&P Dow Jones Indices, is the most widely cited measurement of active manager performance. It compares actively managed U.S. mutual funds against their appropriate S&P benchmarks across equity and fixed-income categories, with results spanning one-year through 20-year horizons. The table below summarizes the percentage of active managers who underperformed their benchmarks across the major equity and fixed-income categories.
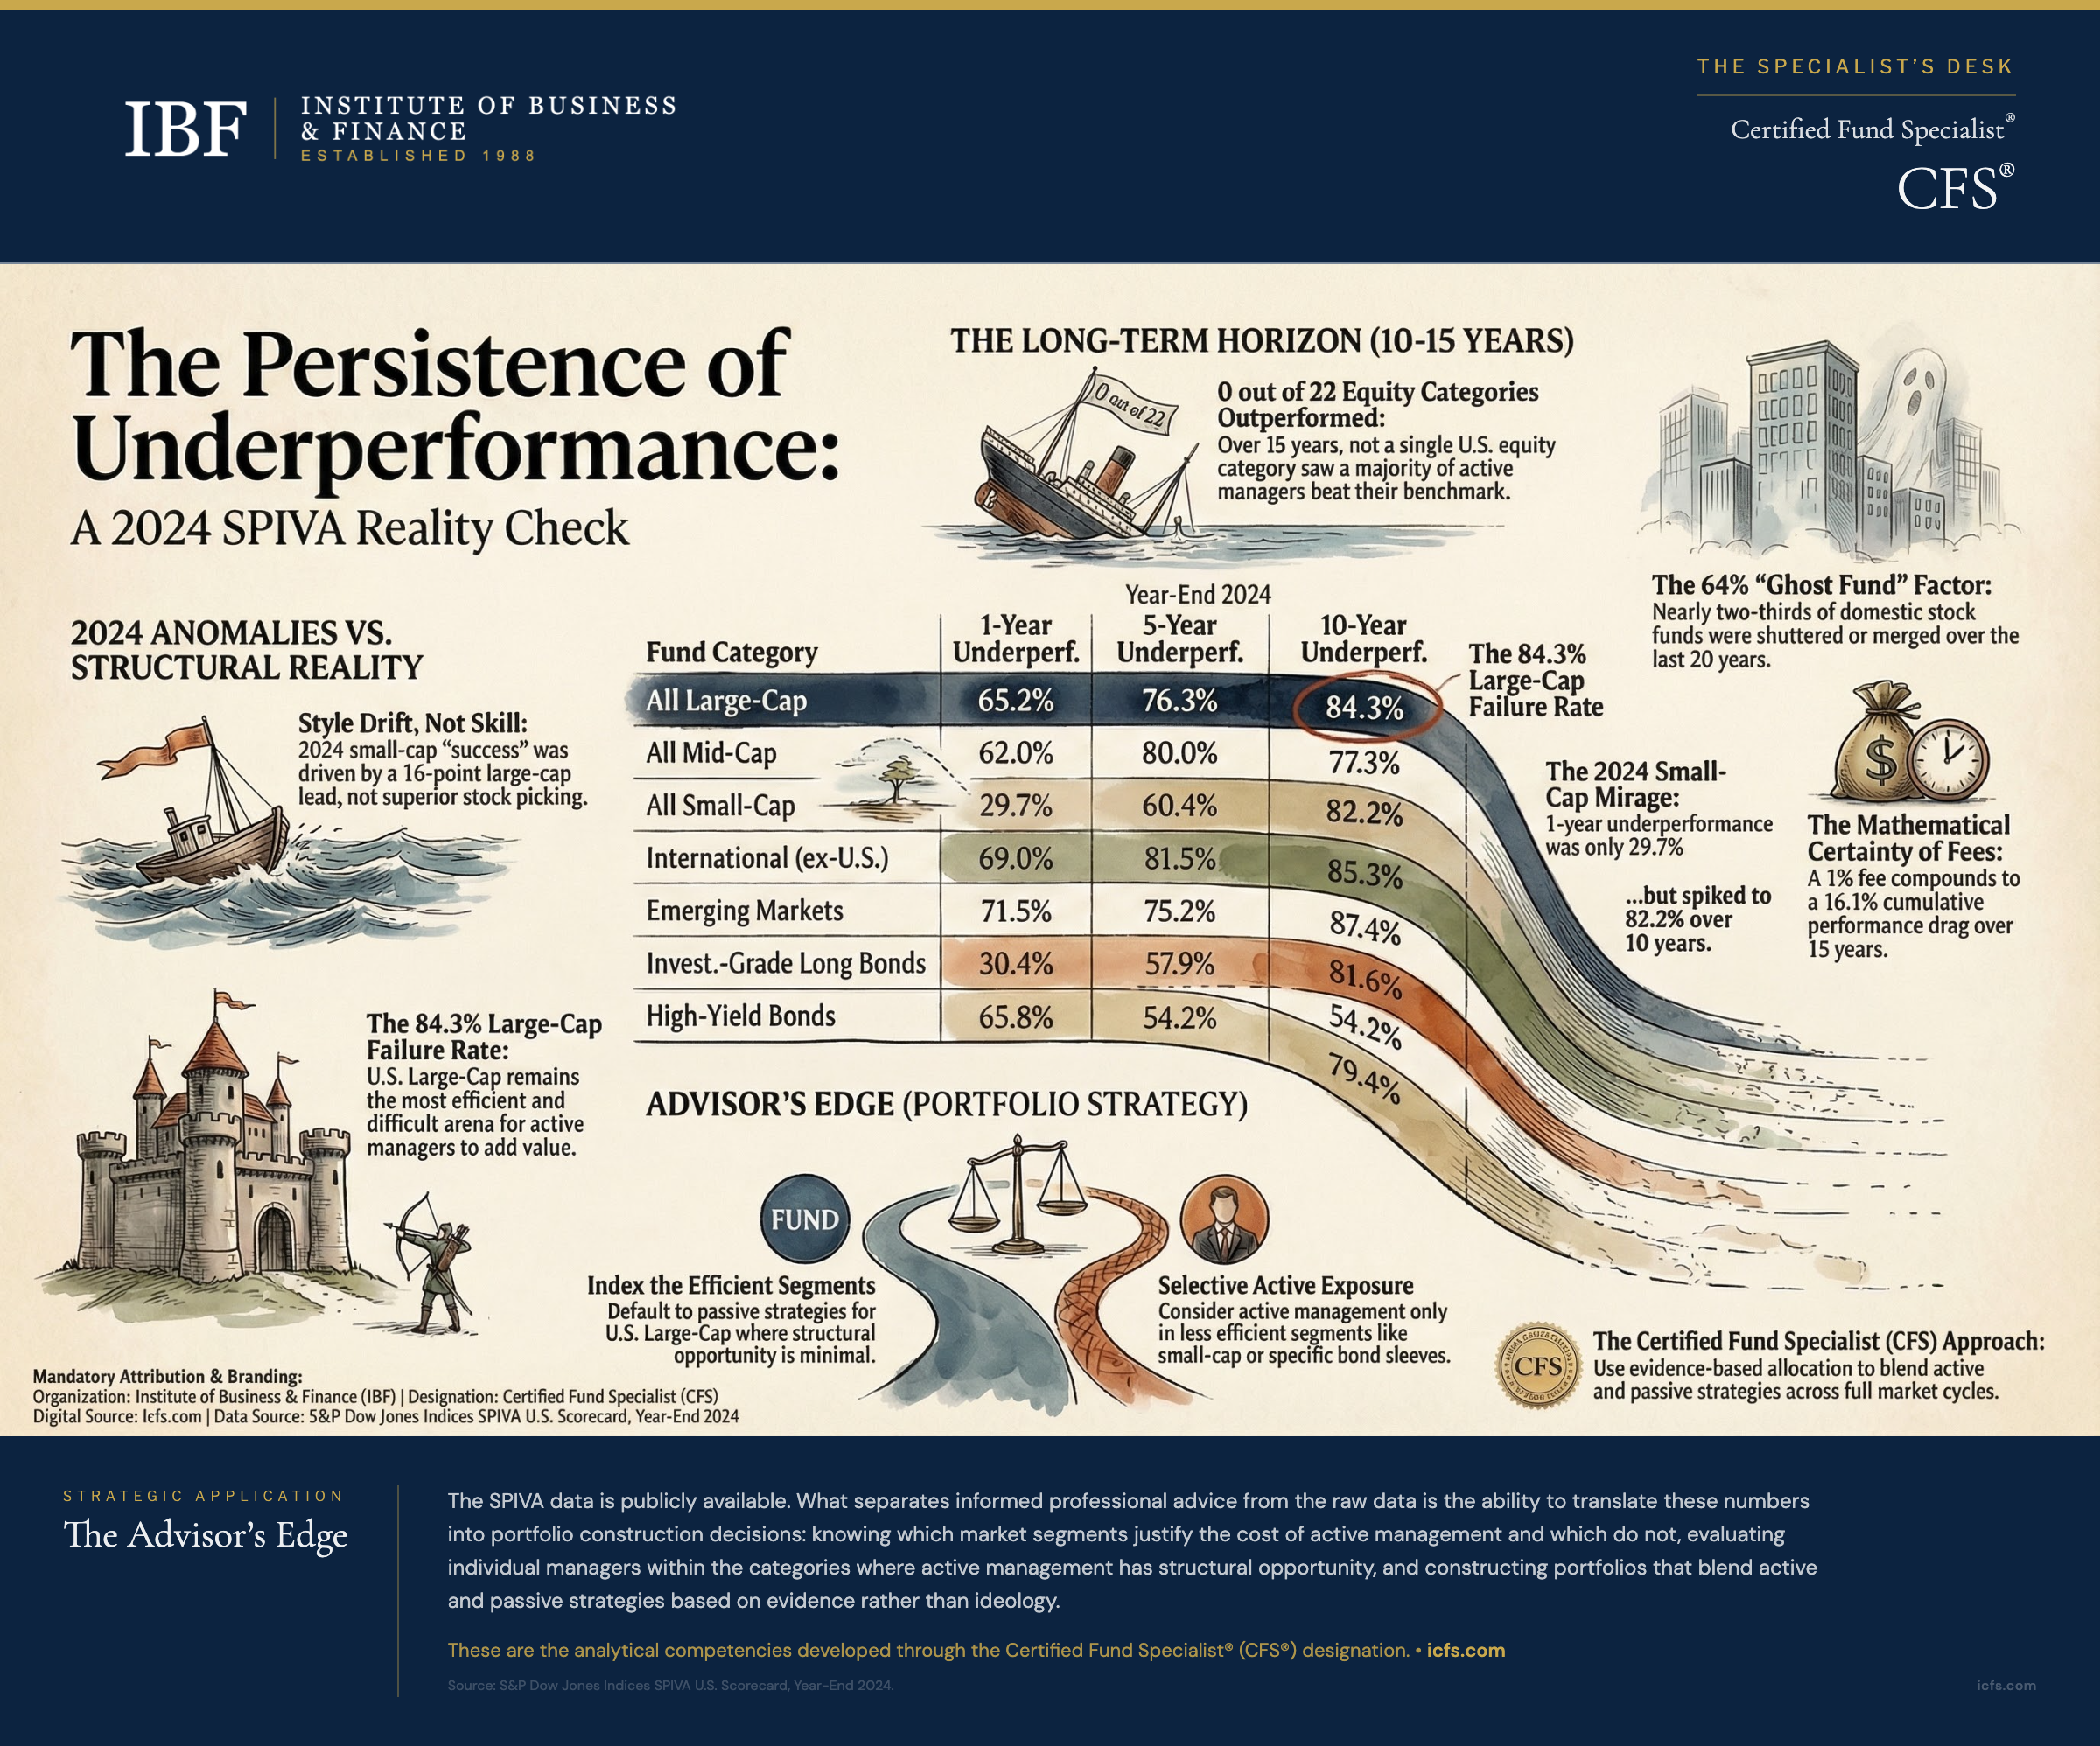
Active Manager Underperformance by Category
| Fund Category | Benchmark | 1-Year | 5-Year | 10-Year |
|---|---|---|---|---|
| All Large-Cap | S&P 500 | 65.2% | 76.3% | 84.3% |
| All Mid-Cap | S&P MidCap 400 | 62.0% | 80.0% | 77.3% |
| All Small-Cap | S&P SmallCap 600 | 29.7% | 60.4% | 82.2% |
| International (ex-U.S.) | S&P World Ex-U.S. | 69.0% | 81.5% | 85.3% |
| Emerging Markets | S&P/IFCI Composite | 71.5% | 75.2% | 87.4% |
| General Investment-Grade Funds | iBoxx $ Liquid Investment Grade | 30.4% | 57.9% | 81.6% |
| High-Yield Bonds | iBoxx US High Yield | 65.8% | 54.2% | 79.4% |
Figures represent the percentage of active funds in each category that underperformed their benchmark over the stated period ending December 31, 2024. Data includes funds that merged or were liquidated during the period. Over the 15-year period, no equity or fixed-income category showed majority active outperformance, with large-cap underperformance exceeding 90%. Source: S&P Dow Jones Indices SPIVA U.S. Scorecard, Year-End 2024.
What the Data Tells Us
The pattern that emerges from the SPIVA data becomes clearer when you read the table from right to left rather than left to right. At the 10-year horizon, every category in the table shows majority underperformance, and most categories show underperformance rates above 80%. The long-term picture is consistent and severe. At the 1-year horizon, the picture is far more varied, and that variation is where most of the misinterpretation happens.
In 2024, seven of 22 equity categories showed majority active outperformance at the one-year mark. That is enough favorable data to populate marketing materials and to sustain the argument that active management “works” in certain categories. The problem is that short-term outperformance reflects a mix of skill, style bias, and market conditions that rarely persists.
The small-cap result illustrates this perfectly. Active small-cap managers had their best year on record, with only 29.7% underperforming the S&P SmallCap 600. That number looks like a vindication of active management in less efficient markets. But S&P Dow Jones Indices identified the primary driver: the S&P 500 outpaced the S&P SmallCap 600 by 16 percentage points in 2024, the widest large-cap-over-small-cap return gap in the annual SPIVA series. Active small-cap managers who tilted their portfolios toward larger-capitalization stocks (a style bias, not a stock-picking skill) captured that spread. The outperformance was real, but its source was opportunity to deviate from the benchmark’s capitalization profile, not the ability to identify mispriced small-cap securities.
As time horizons extend, these style effects wash out and costs compound. A fund charging 80 basis points more than an index fund must beat the index by 0.80% every year just to break even, and that hurdle accumulates relentlessly. Over five years, the cumulative cost drag on a fund with a 1% expense ratio versus a 0.05% index fund exceeds 4.75% before compounding effects. Over 10 years, the arithmetic becomes punishing. That is why the 10-year column in the table shows underperformance rates in the high 70s and 80s across nearly every category.
The data also reveals real differences across market segments. Large-cap U.S. equity, the most competitive investment arena in the world, shows the worst results for active managers at every time horizon. Thousands of analysts scrutinize the same companies, information flows instantly, and trading costs are minimal. The 2024 results (65.2% underperformance at one year, rising to 84.3% at 10 years) are close to the 24-year historical average, which tells you this is a structural result rather than a product of any particular year’s market environment.
Smaller and less efficient markets show modestly better results for active managers, but the improvement is less than many advisors assume. At the 10-year mark, 82.2% of small-cap managers still underperformed. International equity tells a similar story: 85.3% underperformed at 10 years. Even in emerging markets, where the case for active management rests on information asymmetry and limited analyst coverage, 87.4% of active managers underperformed over a decade.
The Fixed-Income Story: A Mixed Year
The 2024 fixed-income results deserve separate attention because they diverged sharply from the equity pattern. Across all bond categories, the average one-year underperformance rate was 41%, and 11 of 16 fixed-income categories saw majority active outperformance. That is a substantially better result than in most years.
General investment-grade funds were a bright spot: only 30.4% of active managers underperformed at the one-year horizon. Rising rates early in 2024 followed by rate cuts later in the year, combined with the disinversion of the yield curve, created a dynamic environment where active duration and credit quality decisions could add value. Municipal bond managers also posted strong results, with majority outperformance across several categories.
High-yield bonds told the opposite story. At the one-year mark, 65.8% of active high-yield managers underperformed, despite high yield being one of the categories where the theoretical case for active management (issuer-specific credit analysis, default prediction) is strongest. Over five years, however, the picture reverses: only 54.2% of active high-yield managers underperformed, suggesting that the skill involved in credit selection may show up over longer periods even when short-term results are unfavorable.
The fixed-income data reinforces a lesson that applies across all categories: one-year results are noisy. The bond managers who outperformed in 2024 benefited partly from skill and partly from being on the right side of duration and credit bets in a year where those bets paid off. The 10-year column, where every bond category shows underperformance rates near or above 80%, reflects the more durable reality.
What Advisors Should Know
The SPIVA data answers one question with unusual clarity: should an advisor default to active or passive management in a given market segment? For U.S. large-cap equity, the answer is unambiguous. Fewer than one in six active managers beat the S&P 500 over 10 years, and identifying which ones will do so in advance is a separate (and equally difficult) problem.
The more useful question for practicing advisors is where the data creates room for active management to work. The category-by-category breakdown reveals a spectrum. At one end, large-cap domestic equity offers almost no structural opportunity for active management. The cost hurdle is too high and the competition too fierce. At the other end, the 2024 data shows that less efficient segments (small-cap equities at short horizons, certain bond categories) can produce periods of widespread active outperformance, though these periods are driven as much by style conditions as by manager skill.
This is where the SPIVA data becomes a decision-making tool rather than just a scorecard. An advisor constructing a portfolio can use the category-level data to guide the active-versus-passive allocation for each sleeve of the portfolio: index the efficient segments, consider active management selectively in less efficient segments, and accept that even in favorable categories the majority of active managers will still underperform over a full market cycle.
One pattern that catches many advisors off guard is the survivorship bias adjustment. The SPIVA methodology accounts for funds that merged or liquidated during the measurement period. Over the 20 years ending December 2024, nearly 64% of domestic stock funds were shuttered or folded into other portfolios. Many performance databases do not make this adjustment, which means they systematically exclude the worst performers and overstate the industry’s track record. An advisor relying on standard database queries without adjusting for dead funds is working with incomplete information.
The Time Horizon Effect
The relationship between time horizon and active manager underperformance runs in one direction: longer periods produce worse results for the active management industry as a whole. Understanding why requires separating two effects.
The first is cost compounding. Expense ratios, trading costs, and cash drag operate continuously. A 1% annual cost difference between an active fund and its index benchmark compounds to a 10.5% cumulative drag over ten years and a 16.1% drag over fifteen years. This is not a theoretical concern. It is a mathematical certainty that every active fund must overcome before it can claim to have added value.
The second effect is mean reversion. Managers who outperform in one period often owe some portion of their results to favorable conditions for their particular style or sector. The 2024 small-cap results are a vivid example: active managers benefited from an unusually wide return gap between large and small companies, a condition that is unlikely to persist at the same magnitude. Over longer periods, these style effects wash out and what remains is the manager’s true ability to add value after costs.
The SPIVA Persistence Scorecard, a companion report, tracks whether top-performing funds maintain their rankings over time. The results are stark: top-quartile funds in one period have little better than random odds of remaining in the top quartile during the next period. The persistence that clients and advisors hope to find in manager selection is largely absent from the data.
This creates a practical challenge for client conversations. Clients often arrive with a specific fund or manager they read about in a financial publication, typically one that outperformed dramatically over the past one or three years. The SPIVA data provides the framework for a productive response: acknowledge the strong recent performance, explain that short-term results reflect a mix of skill, style, and luck, and show how the percentage of outperformers declines as the horizon extends. The data table itself becomes a visual aid in that conversation, grounding the discussion in evidence rather than opinion.
Key Takeaways
- Over 10 years, underperformance rates exceed 80% in nearly every equity and fixed-income category. Cost compounding and mean reversion drive this pattern.
- Small-cap active managers posted record results in 2024 (only 29.7% underperformed), but the driver was a 16-point return gap between large and small caps that favored style-drifting managers, not stock pickers.
- Fixed-income active managers outperformed in 11 of 16 categories in 2024, driven by duration and credit timing in a rate-shifting environment. The 10-year column erases most of that advantage.
- Nearly 64% of domestic stock funds were shuttered or merged over the 20 years ending 2024. Performance databases that exclude these dead funds systematically overstate the industry’s track record.
- The SPIVA data supports a blended approach: index the efficient segments (large-cap domestic equity), consider active selectively in less efficient segments (small-cap, certain bonds), and expect that even favorable categories will revert over full cycles.
The Advisor’s Edge
The SPIVA Scorecard data is publicly available. Any investor can download the report from S&P Dow Jones Indices and review the category-by-category results. What separates informed professional advice from the raw data is the ability to translate these numbers into portfolio construction decisions: knowing which market segments justify the cost of active management and which do not, evaluating individual managers within the categories where active management has structural opportunity, and constructing portfolios that blend active and passive strategies based on the evidence for each segment rather than ideology for either approach. These are the analytical competencies that the Certified Fund Specialist® (CFS®) designation develops across its curriculum. For advisors interested in the research on whether skilled active managers can be identified in advance, the Can You Identify Superior Active Fund Managers? article explores the persistence and manager selection evidence in depth.
Sources and Notes: Performance data from S&P Dow Jones Indices SPIVA U.S. Scorecard Year-End 2024 and SPIVA Persistence Scorecard reports. The SPIVA methodology uses the CRSP Survivor-Bias-Free U.S. Mutual Fund Database, which includes funds that have merged or liquidated, providing a more complete picture than databases that track only surviving funds. Category assignments follow S&P Dow Jones Indices classification methodology. Fund survivorship data from S&P Dow Jones Indices. Data as of December 31, 2024. S&P DJI typically publishes the year-end SPIVA U.S. Scorecard in early March; this article is refreshed annually once that data is available, typically in March or April.