The first mutual fund to cross $2 trillion in assets is not actively managed. It does not employ a team of analysts hunting for undervalued stocks. It does not time the market or rotate between sectors. The Vanguard Total Stock Market Index Fund simply owns virtually every publicly traded company in the United States, charges four basis points for the privilege, and has attracted more investor capital than any other fund in history.
That single data point captures something real about where the mutual fund industry stands today. But the full story is more interesting than the passive-wins-everything headline suggests. Among the 20 largest funds, you will find a handful of actively managed survivors that have held their positions for decades, a money market fund that ballooned during the rate hiking cycle, and a 97-year-old balanced fund that quietly outperforms most of its flashier peers. This list reveals not just which funds are biggest, but which investment philosophies have earned (and kept) the trust of millions of investors over time.
For financial advisors, the data matters because clients ask about these funds constantly. They see the names in their 401(k) menus, in financial headlines, and in the portfolios of friends and family. Being able to explain what these funds actually do, why they have grown so large, and whether they belong in a given client’s portfolio is a foundational professional skill.
The 20 Largest U.S. Mutual Funds
The following table ranks the 20 largest U.S. mutual funds by total net assets across all share classes as of December 31, 2025. Exchange-traded funds and institutional-only share classes are excluded except where noted. Assets are approximate and reflect the best available public data from multiple sources.
| Rank | Fund | Ticker | Approx. AUM | Category | Expense Ratio |
|---|---|---|---|---|---|
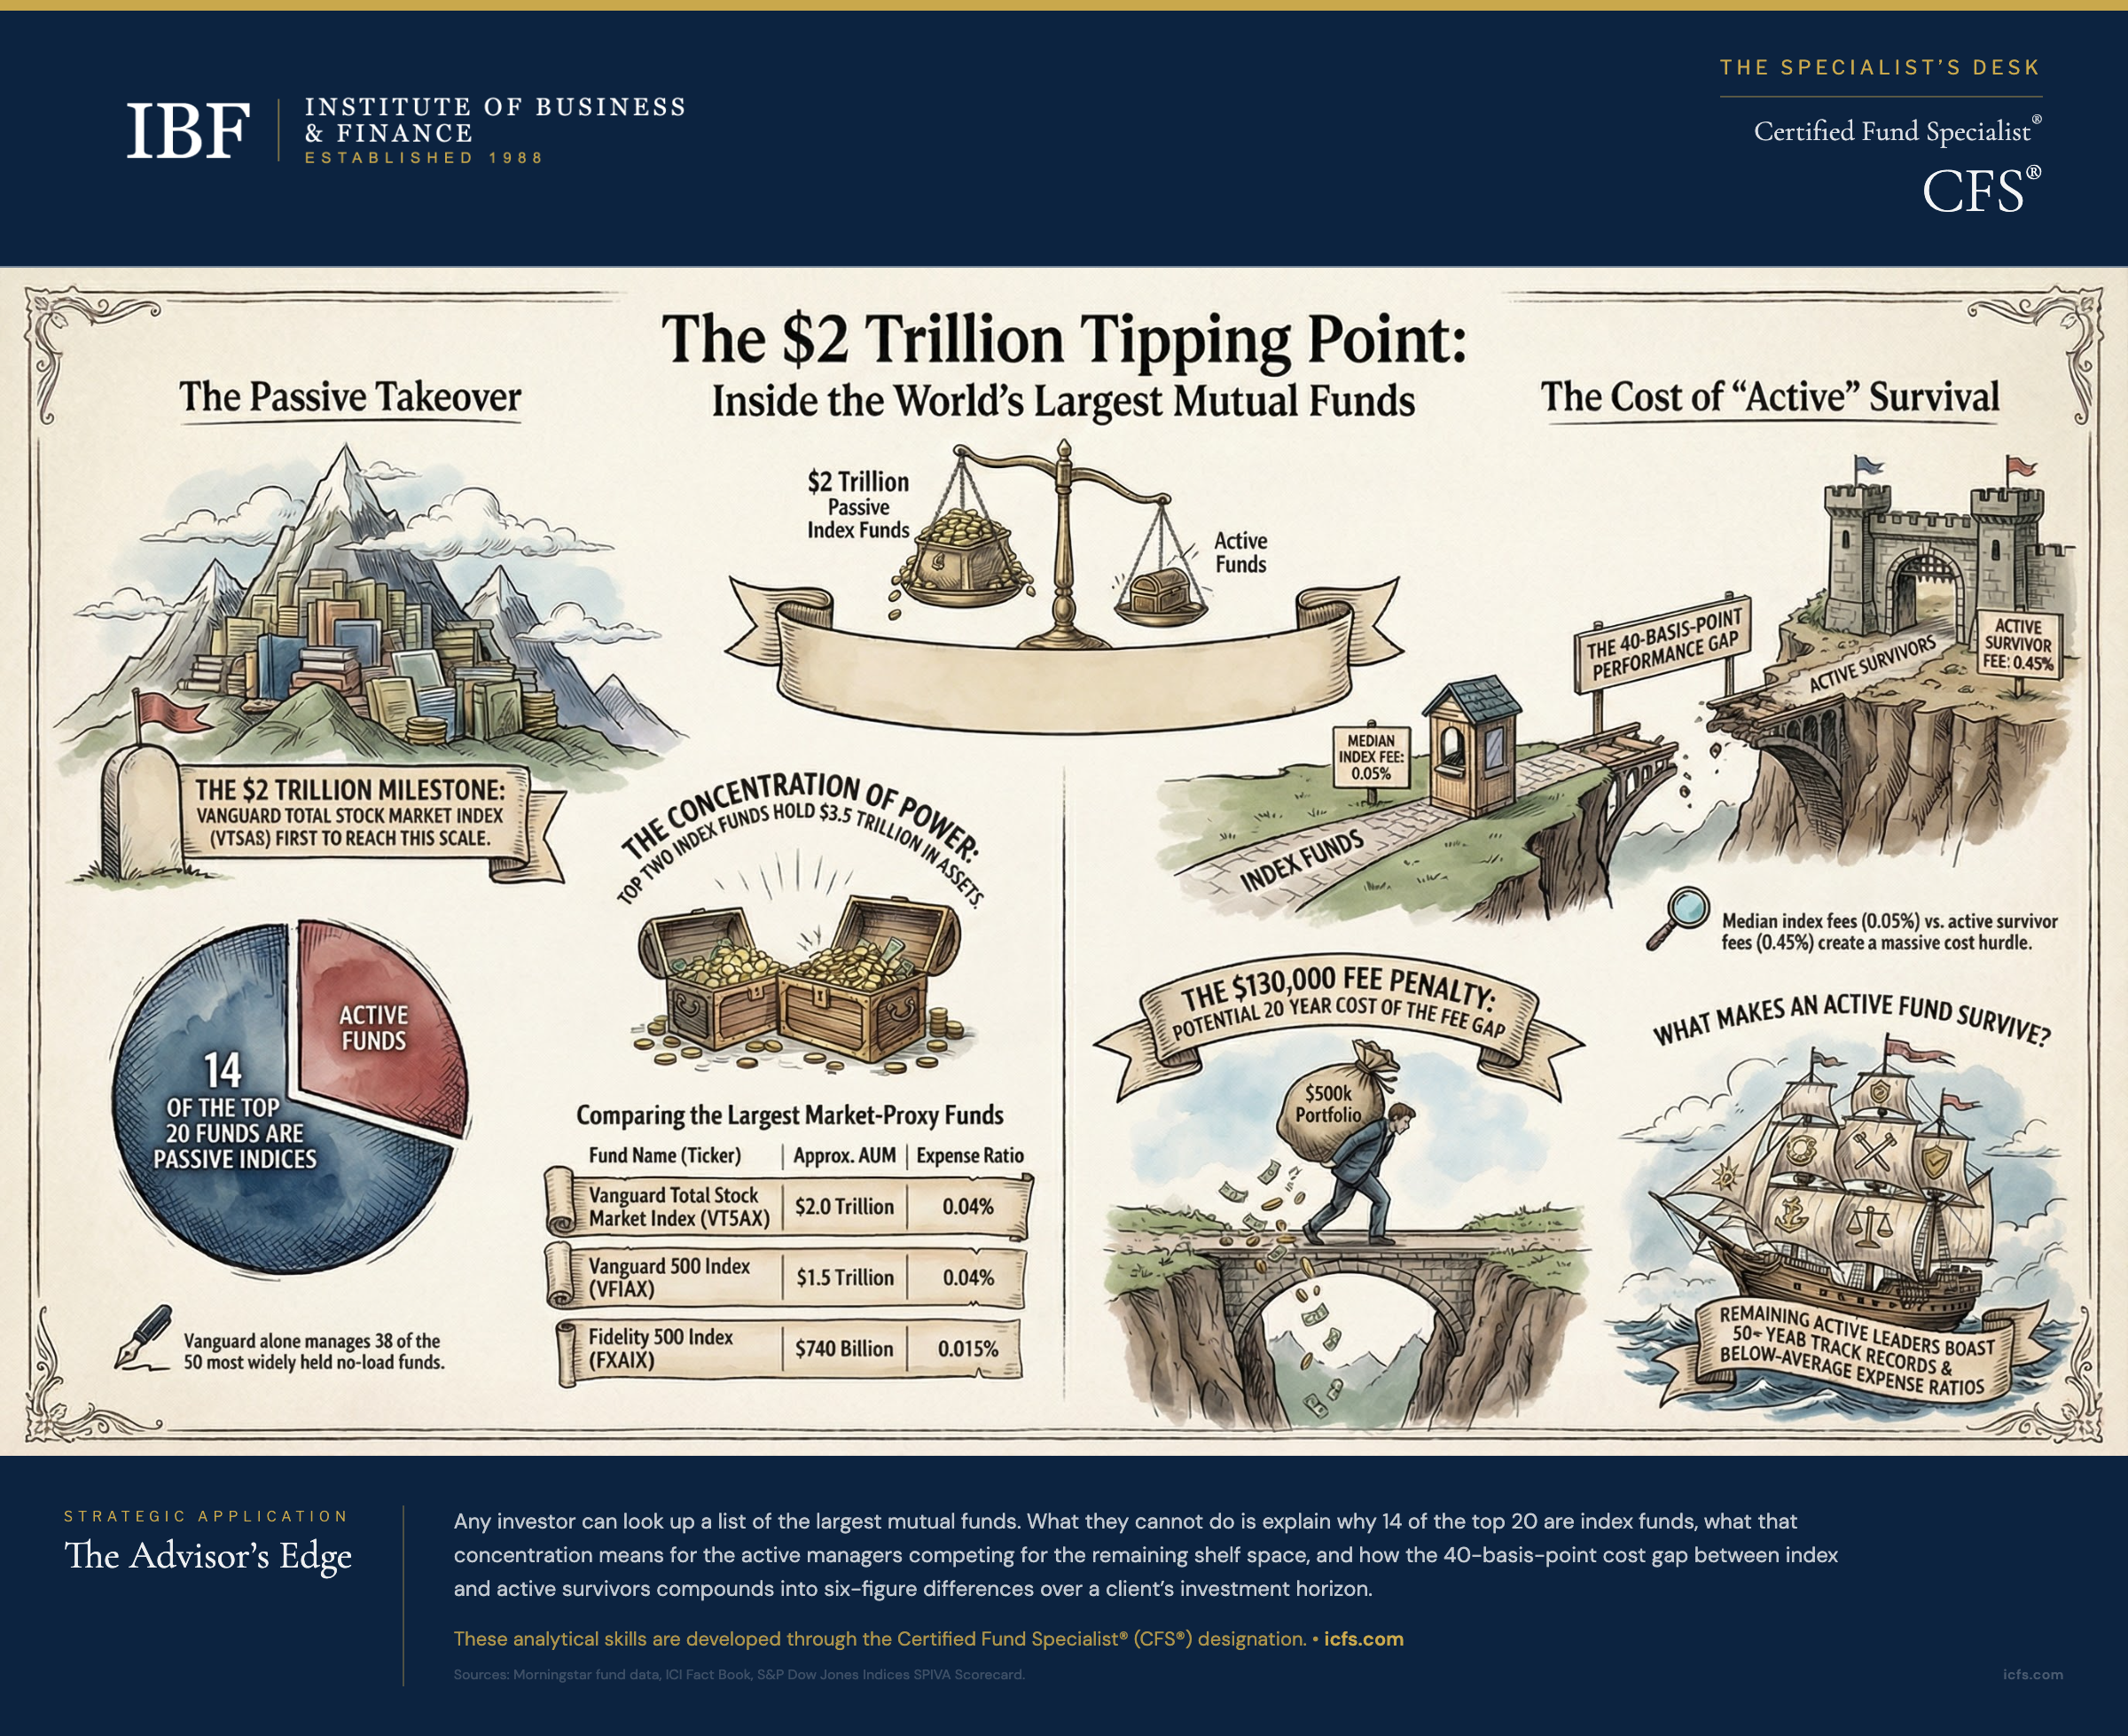
| 1 | Vanguard Total Stock Market Index | VTSAX | ~$2.0 trillion | U.S. Equity Index | 0.04% |
| 2 | Vanguard 500 Index | VFIAX | ~$1.5 trillion | S&P 500 Index | 0.04% |
| 3 | Fidelity 500 Index | FXAIX | ~$740 billion | S&P 500 Index | 0.015%* |
| 4 | Vanguard Total International Stock Index | VTIAX | ~$500 billion | Intl Equity Index | 0.12% |
| 5 | Vanguard Total Bond Market Index | VBTLX | ~$340 billion | U.S. Bond Index | 0.05% |
| 6 | Fidelity Government Money Market | SPAXX | ~$300 billion | Money Market | 0.42% |
| 7 | Vanguard Growth Index | VIGAX | ~$200 billion | U.S. Growth Index | 0.05% |
| 8 | Fidelity Contrafund | FCNTX | ~$176 billion | U.S. Large Growth (Active) | 0.39% |
| 9 | Fidelity Government Cash Reserves | FZCXX | ~$170 billion | Money Market | 0.42% |
| 10 | Vanguard Institutional Index | VINIX | ~$160 billion | S&P 500 Index | 0.04% |
| 11 | Vanguard Total World Stock Index | VTWAX | ~$130 billion | Global Equity Index | 0.10% |
| 12 | Vanguard Wellington | VWENX | ~$120 billion | Balanced (Active) | 0.17% |
| 13 | Vanguard Balanced Index | VBIAX | ~$110 billion | Balanced Index | 0.06% |
| 14 | Vanguard Mid-Cap Index | VIMAX | ~$100 billion | U.S. Mid-Cap Index | 0.05% |
| 15 | Strategic Advisers Fidelity U.S. Total Stock | FCTDX | ~$100 billion | U.S. Equity (Active) | 0.29% |
| 16 | Vanguard Value Index | VVIAX | ~$95 billion | U.S. Value Index | 0.05% |
| 17 | Dodge & Cox Stock | DODGX | ~$119 billion | U.S. Large Value (Active) | 0.51% |
| 18 | Vanguard Small-Cap Index | VSMAX | ~$90 billion | U.S. Small-Cap Index | 0.05% |
| 19 | Vanguard International Bond Index | VTABX | ~$85 billion | Intl Bond Index | 0.11% |
| 20 | T. Rowe Price Blue Chip Growth | TRBCX | ~$80 billion | U.S. Large Growth (Active) | 0.56% |
A note on scope: this ranking focuses on no-load mutual funds available to individual investors. If load funds were included, several American Funds products (Capital Group) such as Growth Fund of America, Investment Company of America, and Washington Mutual Investors would likely appear. The AAII methodology, which provides the most reliable year-end data, excludes load funds and adviser-only share classes.
What the Data Reveals
The composition of this list tells a story that goes beyond which funds are biggest. Three patterns stand out.
Passive dominance is nearly total. Of the 20 largest funds, 14 are index funds. The top two alone hold a combined $3.5 trillion. Among the 50 most widely held no-load mutual funds, Vanguard accounts for 38 of them. This concentration reflects two decades of consistent flows out of actively managed domestic equity funds and into index products, a trend the Investment Company Institute has documented in every annual Fact Book since 2007.
The active survivors are instructive. Four actively managed funds remain on the list: Fidelity Contrafund, Vanguard Wellington, Dodge & Cox Stock, and T. Rowe Price Blue Chip Growth. These are not random survivors. Each has at least a 30-year track record, a clearly articulated investment process, and an expense ratio well below the active category average. Their persistence tells advisors something important about what clients actually value in an active manager over time: consistency of process and discipline of fees matter more than any single year of outperformance.
The expense ratio gap has widened. The median expense ratio for the index funds on this list is 0.05%. The median for the active funds is 0.45%. That 40-basis-point gap compounds meaningfully over a 20-year relationship. On a $500,000 portfolio growing at a moderate rate, the compounding effect of that fee gap can exceed $130,000 over two decades, before accounting for any performance differential. This is not an argument that active management cannot add value. It is a reminder that the value must be substantial enough to overcome a structurally higher cost, and it is the kind of calculation advisors should be making explicitly with clients.
When Size Becomes a Limitation
The scale of these funds creates advantages for investors, primarily through expense ratios that smaller funds cannot match. But scale also introduces constraints that advisors should understand.
A fund managing $2 trillion in U.S. equities effectively owns the market. Its performance will closely track broad market returns regardless of any investment thesis, simply because it is too large to deviate meaningfully. For index funds, this is the point. For active funds, size can erode the very flexibility that justifies their fees. A large-cap active manager with over $100 billion in assets cannot take a meaningful position in a mid-cap opportunity without moving the stock’s price. The investment universe available to the largest active funds narrows as their assets grow.
This is one reason why the most successful boutique active managers often close to new investors at a fraction of the asset levels shown on this list. It is also why several of the active funds that once populated the top 20, including many American Funds products and the former Magellan Fund, have seen their relative positions decline as assets either plateaued or shifted to lower-cost alternatives.
For advisors, the practical takeaway is clear: the largest funds are excellent building blocks for core portfolio exposure, but they are not the only tools in the kit. Targeted active management in less efficient market segments (small cap, international, alternatives) may add value precisely because those strategies operate at a scale where skill can still differentiate.
What Advisors Should Know About the Client Conversation
When a client asks about the largest mutual funds, they are rarely asking about total net assets. They are asking a version of a more personal question: “Should I own these funds? Are they safe? Am I missing something better?”
The data on this page equips advisors to answer that question substantively. The choice between VTSAX and VFIAX, for instance, is not trivial. A total stock market index includes mid-cap and small-cap exposure that an S&P 500 index does not. Over long periods, that additional exposure has historically produced modestly higher returns with modestly higher volatility. Whether that tradeoff serves a specific client depends on their time horizon, risk capacity, and the role the position plays in their overall allocation.
Similarly, a client who notices Fidelity Contrafund in their 401(k) menu and asks whether it is worth the higher expense ratio deserves an answer grounded in data, not a blanket “active management is dead” dismissal. Contrafund has survived on this list because it has delivered competitive risk-adjusted returns over decades while maintaining a disciplined large-growth mandate. Whether it belongs in a specific client’s portfolio depends on what else is in that portfolio, what the client is paying in total, and whether the client’s behavioral tendencies favor the stability of a single-manager fund over the mechanical consistency of an index.
These are the conversations that distinguish a financial professional from a fund selector. The data is the starting point. The analysis is the value.
A Brief History and a Look Ahead
The dominance of index funds on this list would have been unthinkable 25 years ago. At the start of 2000, the largest mutual fund was Fidelity Magellan, an actively managed fund that had built its reputation on Peter Lynch’s stock-picking prowess in the 1980s. Magellan lost that title to the Vanguard 500 Index Fund by mid-2000 as the dot-com bust hit growth-heavy active funds first. Vanguard’s index fund was still a fraction of its current size. The idea that a single index fund would someday manage $2 trillion would have seemed absurd.
The shift happened gradually, then suddenly. Academic research on active manager underperformance accumulated throughout the 2000s. The 2008 financial crisis accelerated the trend as investors questioned whether active fees were justified by active results. The rise of target-date funds in 401(k) plans channeled billions into index building blocks. And Vanguard’s mutual ownership structure, which returns profits to fund shareholders through lower fees rather than distributing them to an external parent company, created a compounding advantage that is now nearly impossible for competitors to replicate.
The practical conclusion for portfolio construction is a core-satellite approach. Use low-cost index funds for the most efficient market segments, where the funds on this list excel. Consider selective active management only in segments where the evidence supports it and the manager’s fees are reasonable relative to potential alpha. This framework explains why the surviving active managers on the top-20 list tend to operate in specific areas (large-cap growth, large-cap value, balanced allocation) rather than competing head-to-head with the broad market index.
Looking ahead, the most significant structural development may be the convergence of mutual fund and ETF wrappers. Recent regulatory developments have opened the door for fund companies to offer both ETF and mutual fund share classes within a single portfolio, combining the tax efficiency of ETFs with features mutual fund investors value: fractional shares, automatic investment plans, and retirement plan integration. As of year-end 2025, Dimensional Fund Advisors (DFA) had received the first formal SEC exemptive order to operate dual share class funds, and several other major sponsors had filed applications. If the structure gains broad approval, several of the largest funds on this list could eventually add ETF share classes, and the boundary between the two structures would blur further.
Key Takeaways
- Passive index funds hold $3.5 trillion in the top two positions alone, and the median expense ratio for the 14 index funds on the list is just 0.05%, compared to 0.45% for active survivors.
- The four remaining active funds on the list (Contrafund, Wellington, Dodge & Cox Stock, Blue Chip Growth) are not random survivors—each has a 30+ year track record, articulated investment process, and expense ratios well below the active category average.
- Fund size creates a fundamental constraint for active managers: a $100+ billion large-cap fund cannot take meaningful positions in mid-cap opportunities without moving stock prices, which narrows the investment universe and erodes the flexibility that justifies higher fees.
- The 40-basis-point expense ratio gap between index and active funds compounds to exceed $130,000 over 20 years on a $500,000 portfolio, a calculation advisors should make explicit with clients when evaluating active fund justification.
- Total-market exposure (VTSAX) outperforms S&P 500-only exposure (VFIAX) over long periods due to mid-cap and small-cap inclusion, a distinction that matters for clients’ specific portfolio roles and time horizons.
The Advisor’s Edge
The data on this page is freely available. Any client with a search engine can find the names and asset totals of the largest mutual funds. What they cannot as easily find is the analytical framework to interpret what this data means for their specific situation.
How expense ratios compound over decades. When total-market exposure serves a client better than S&P 500 exposure. Whether an active manager’s track record justifies their fee. How fund selection in taxable versus tax-advantaged accounts affects after-tax wealth. How to coach clients through the behavioral patterns that cause real investors to underperform the very funds they own. These are the questions a financial professional works through at the portfolio level, not the product level.
This kind of depth is what the Certified Fund Specialist (CFS) designation develops. The CFS curriculum covers fund structure and mechanics, expense analysis, risk measurement, portfolio construction, tax-efficient placement strategies, and the behavioral coaching frameworks that help clients stay invested through volatile markets.
For a deeper look at how the companies behind these funds have grown to dominate the industry, see Largest Mutual Fund Companies by AUM.
Sources and Notes: Fund asset data compiled from the AAII 2026 Top Mutual Funds Guide (year-end 2025 data), Morningstar Fund Family 150 Digest, Vanguard and Fidelity public fund disclosures, and Dividend Power annual mutual fund rankings. Expense ratios sourced from fund prospectuses and Morningstar. Rankings reflect total net assets across all share classes for no-load funds available to individual investors. Load funds (including American Funds/Capital Group products) and institutional-only share classes are excluded per the AAII methodology. AUM figures are approximate. FXAIX expense ratio: The Fidelity 500 Index Fund prospectus lists a net expense ratio of 0.015%; some third-party sources, including Morningstar, display a rounded figure of 0.02%, but both refer to the same fee. This article is refreshed annually with year-end data.