Every practicing advisor has heard the pitch: “10% buffer” or “-10% floor.” Both reduce market risk. Neither eliminates it. But the typical advisor conversation stops there, leaving clients confused the first time they receive a quarterly statement showing a loss despite “having a buffer.”
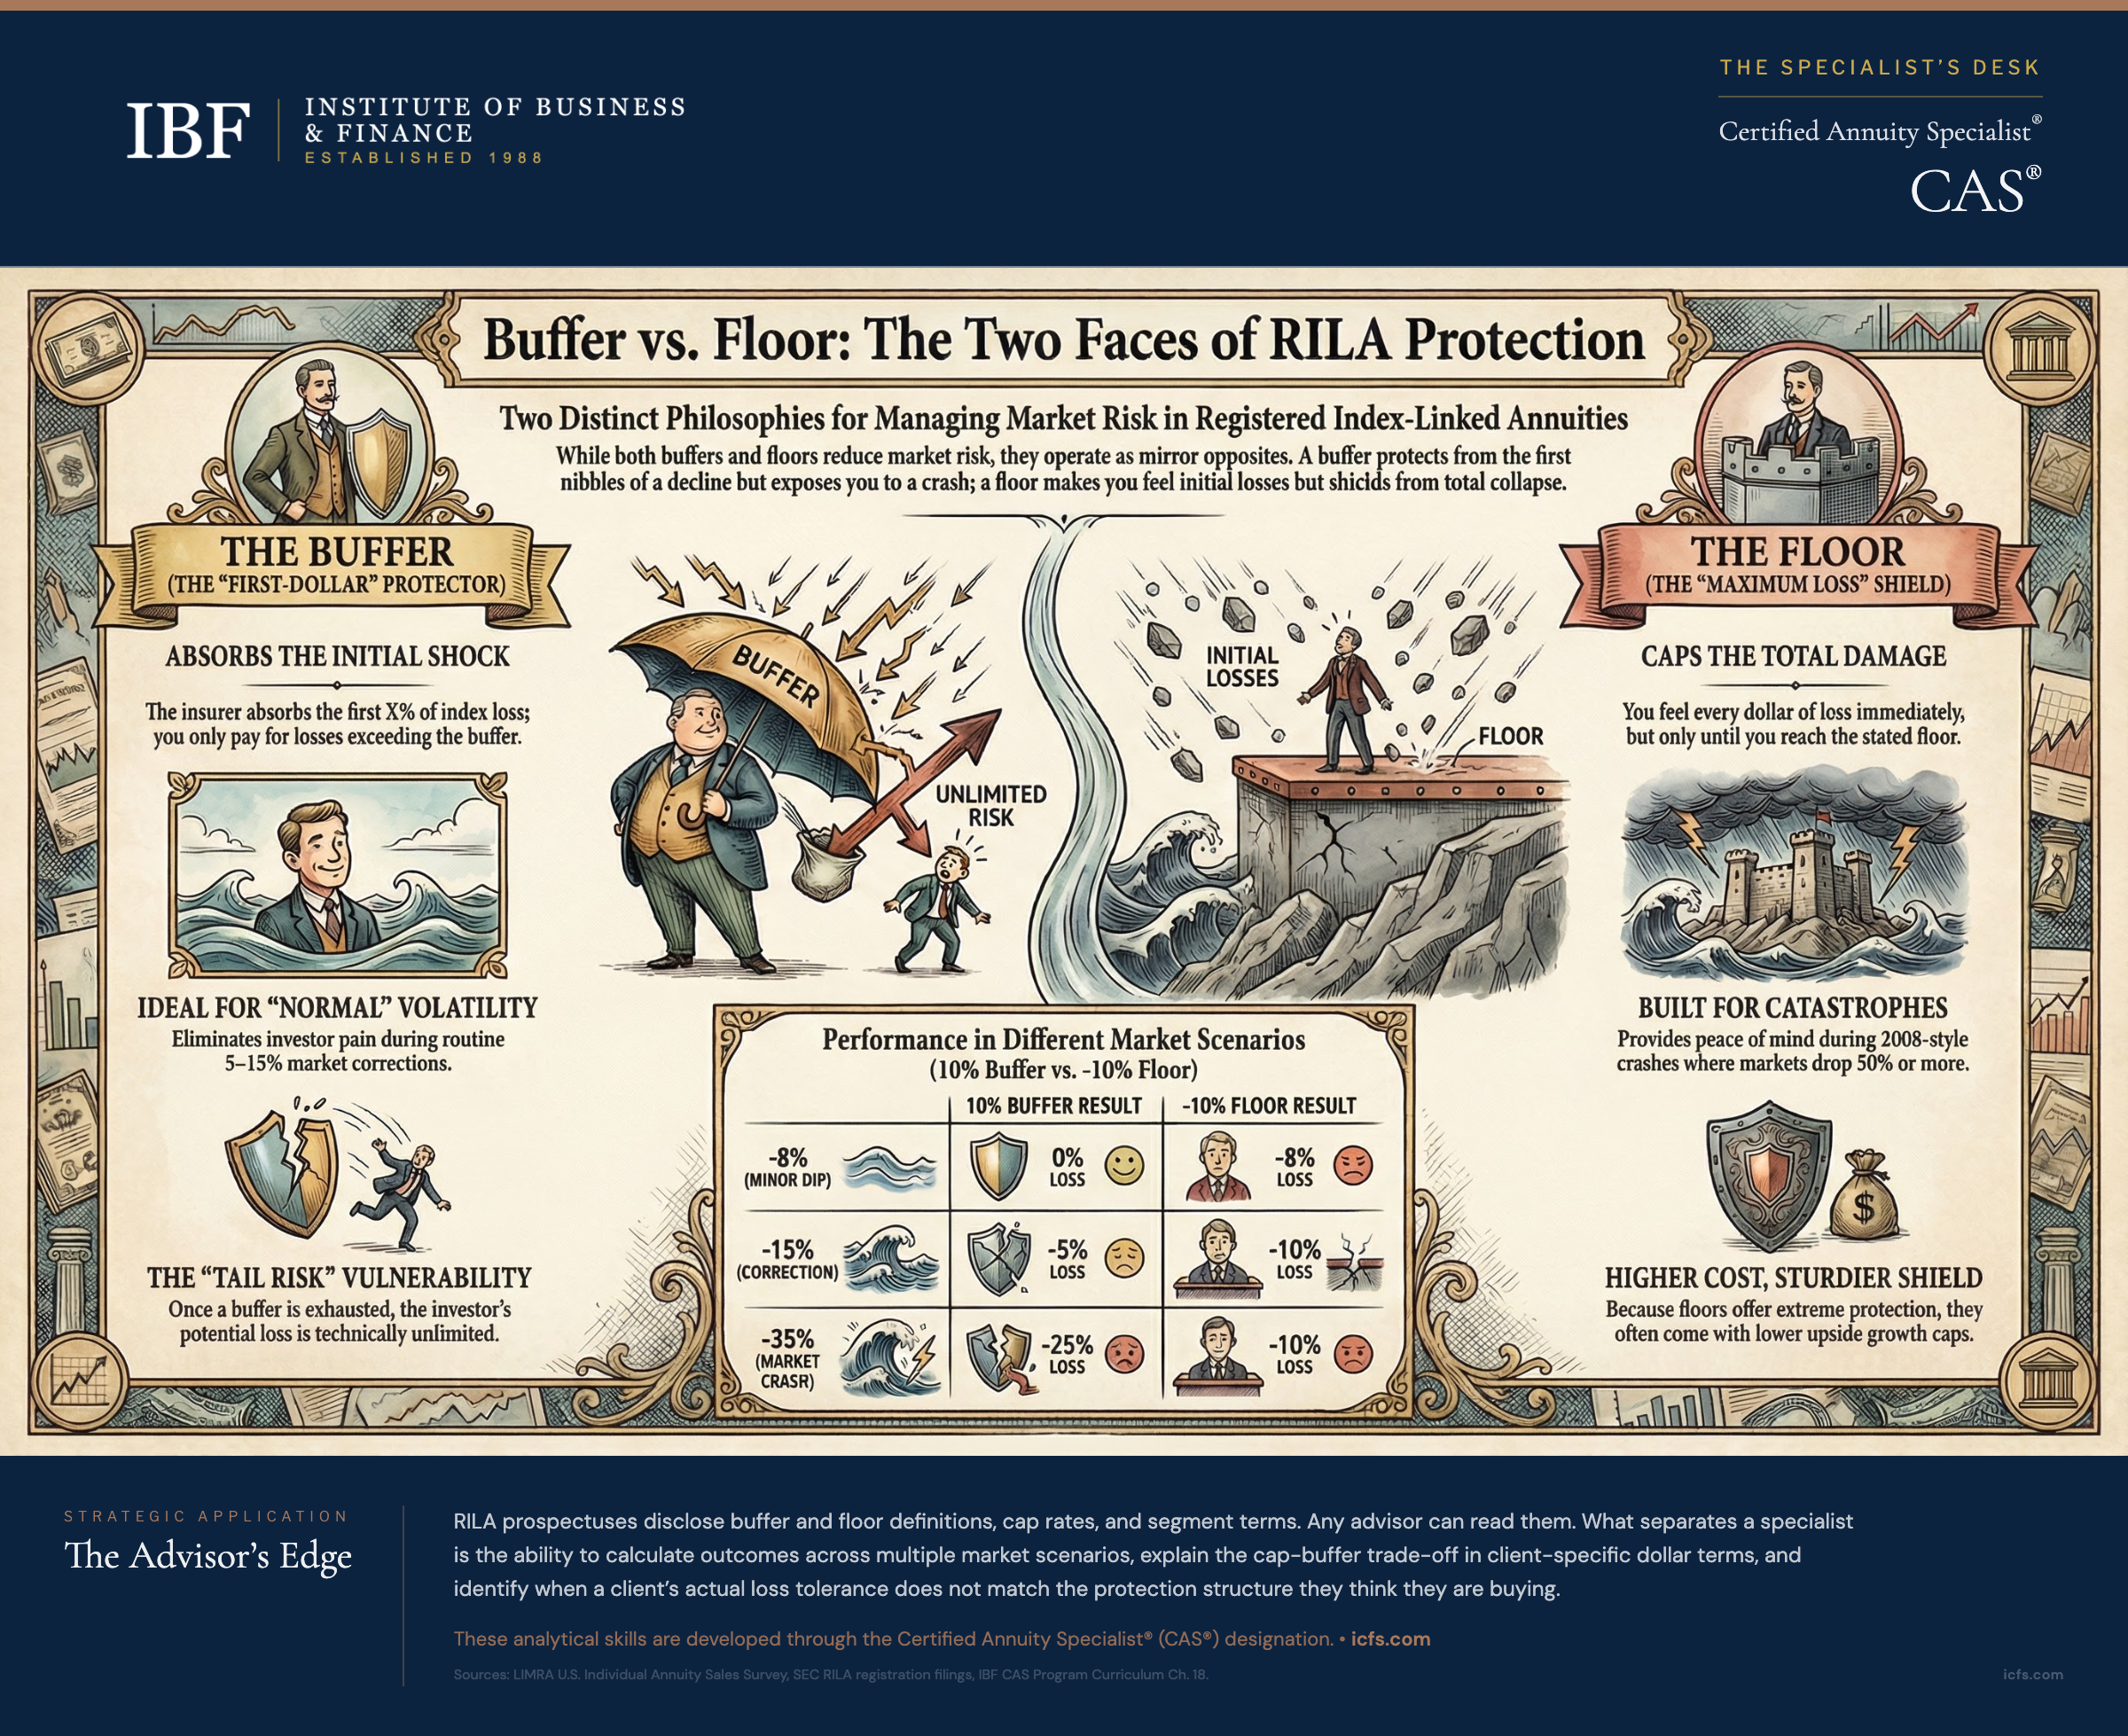
The confusion is understandable. Buffers and floors occupy opposite positions on the risk spectrum. A 10% buffer on a RILA produces zero loss if the index falls 8%, but the full 8% loss if it falls 28%. A -10% floor produces an 8% loss when the index falls 8%, but capped at 10% loss even if it falls 28%. The math is simple. Understanding which structure actually matches your client’s tolerance is the harder part.
What RILAs Are and Why They Exist
Registered Index-Linked Annuities have grown from a niche product in the early 2010s to one of the fastest-growing segments of the annuity market. In 2025, RILAs generated $79.5 billion in annual sales, compared to $3.7 billion a decade earlier. This growth is not accidental. RILAs fill a specific position no other product occupies cleanly.
Fixed Indexed Annuities (FIAs) guarantee principal against market losses when held to term. They protect every dollar of premium from index declines but cap your upside. Variable annuities offer unlimited growth potential but expose you to full market losses. RILAs split the difference: higher growth potential than FIAs, but you give back some downside protection to get it.
The mechanism works like this. Life insurers invest mostly in bonds (usually 90%+) and use the remainder to buy index options. The more principal they’re willing to risk, the larger their options budget and the higher the caps or participation rates they can offer. An FIA keeping 100% of premiums off the table might offer a 10% cap. A RILA accepting a 10% buffer can often offer a 15% cap. A RILA accepting a 20% buffer might offer 20% or higher.
This is not marketing language. It is basic economics. Protection costs money. You are paying for it either in capped upside (FIA) or potential downside loss (RILA). RILAs trade one form of cost for another.
Buffer Mechanics: How a 10% Buffer Actually Works
A buffer absorbs a stated percentage of index losses before the investor experiences any loss. The critical word is “absorbs.” Once the buffer is exhausted, the investor feels the rest.
Imagine a RILA with a 10% buffer linked to the S&P 500. The index value at segment start is 5,000. At segment end, it stands at 4,700. That is a 6% decline. The buffer absorbs this entire 6%. The investor’s account shows zero loss. The buffer has 4% of protection remaining.
Now suppose the index falls to 4,400 instead. That is a 12% decline. The buffer absorbs the first 10%, but the investor feels the remaining 2%. An investor with $200,000 in this contract loses $4,000.
Push the decline further. Index falls to 4,000. That is a 20% decline. The buffer absorbs 10%. The investor absorbs 10%. A $200,000 account loses $20,000.
One more scenario. Index falls 35% to 3,250. The buffer absorbs the first 10%. The investor absorbs the remaining 25%. A $200,000 account loses $50,000.
This is where the common misconception surfaces. A client who heard “10% buffer” often assumes their maximum loss is 10%. It is not. The buffer is the amount of loss the insurer absorbs. Your maximum loss is theoretically unlimited (though no major stock index has fallen 90% in a three-year period).
The buffer’s real value appears in ordinary volatility. Market corrections of 10-15% are historical regulars. A 10% buffer eliminates investor pain through these common events. A 20% buffer covers most downturn scenarios without loss. A 15% buffer sits between. The choice is not “do I want to protect myself?” It is “from which dollar of loss do I want protection to kick in?”
Consider two clients with $300,000 each. The market falls 18% over a two-year segment. Client A has a 10% buffer. She feels the full 8% loss beyond the buffer: $24,000 gone. Client B has a 20% buffer. He feels nothing. Both paid the price of higher buffers in the form of lower caps, but in a downmarket, Client B’s choice vindicated itself.
Buffer Exhaustion and the Cap Trade-Off
This is the part of the conversation where advisors often waffle. They say things like “of course the buffer can be exhausted” without making the client viscerally understand what that means.
Be explicit. Show scenarios. Use their specific numbers.
A client considering a RILA with a 10% buffer and 14% cap should see:
- If the market rises 20%, they get 14% (the cap). The buffer sits unused.
- If the market falls 8%, they get 0% (the buffer absorbs it). The cap sits unused.
- If the market falls 25%, they lose 15% (the buffer absorbed 10%, they absorbed 15%). Both mechanisms are used, just in opposite directions.
The cap and buffer are economically linked. Higher buffers mean lower caps. A 10% buffer might come with a 15% cap. The same contract with a 20% buffer might offer only a 9% cap. This trade-off is not negotiable. Larger protection always costs something.
This is where suitability analysis gets specific. An 80-year-old with limited time horizon and no need for growth might prioritize a 25% buffer even at a 7% cap. A 55-year-old with 20+ years until retirement might accept a 10% buffer to unlock a 16% cap. The question “what growth rate do you need?” and “what loss can you genuinely tolerate?” should drive the cap-buffer choice, not arbitrary preference.
Floor Mechanics: How a -10% Floor Works
A floor sets a maximum loss the investor can experience, regardless of how far markets fall. Unlike a buffer, the investor feels smaller losses immediately. The floor only prevents losses beyond its level.
A -10% floor means the investor can lose up to 10% of the contract value, but not more. The insurance company absorbs everything beyond that point.
Index falls 5%: The investor loses 5%. The floor has not been reached. No protection engaged.
Index falls 10%: The investor loses 10%. The floor is fully engaged, and the investor is at the boundary.
Index falls 15%: The investor loses 10% (floor limits it). The insurance company absorbs the additional 5%.
Index falls 40%: The investor still loses 10%. The insurance company absorbs the remaining 30%.
This is the mirror image of a buffer. With a buffer, small losses are free. With a floor, all losses up to the floor level cost you. But with a floor, severe losses do not cost any more than moderate ones.
Consider Patricia with a -10% floor and an 18% cap, versus Gerald with a 10% buffer and a 15% cap. Both invest $150,000 for a three-year segment.
Market rises 30%: Patricia gains 18% ($27,000). Gerald gains 15% ($22,500). Patricia’s cap is higher.
Market falls 6%: Patricia loses 6% ($9,000). Gerald loses 0%. Gerald’s buffer is better.
Market falls 40%: Patricia loses 10% ($15,000). Gerald loses 30% ($45,000). Patricia’s floor is dramatically better.
The trade-off between buffers and floors is not about whether protection is better. It is about the magnitude of the loss you expect and can tolerate.
When Each Strategy Serves a Client Better
A client with excellent financial resources and a long time horizon can live with buffers. If the market falls 25%, they lose 15% (with a 10% buffer), but they have time to recover. A client living primarily on portfolio withdrawals cannot stomach a 15% loss even once. For them, a floor is essential.
A client who cannot accept any loss should not own a RILA at all. An FIA with 100% principal guarantee is the correct product. This is the single most important suitability distinction.
For clients who can accept loss, the buffer-floor decision hinges on two factors: the severity of the loss they can live with, and the market scenarios they expect to encounter.
Ask the client this way: “If the S&P 500 fell 30% during your contract term, what percentage loss on your money could you live with?”
If they answer “I couldn’t handle more than a 10% loss,” a floor is appropriate.
If they answer “I probably couldn’t live through a 20% loss, but temporary dips of 5% I can ignore,” a buffer is appropriate.
The second answer is much more common. Most investors fear catastrophic permanent loss. They are uncomfortable with volatility. The 10-15% corrections that happen every few years feel like catastrophes in real time, even though they are routine. A buffer eliminates pain from routine corrections and lets the client focus on long-term strategy.
The segment term also matters. A six-year segment with a floor makes little sense. The investor will feel losses from temporary dips throughout the period. A one-year segment with a floor is more defensible. A buffer plays better with longer segments because temporary market dips will occur but recover before the segment ends.
Cap Structures and the Buffer-Cap Trade-Off
The cap is the ceiling on returns within a segment. For most RILAs, the cap applies once per segment, regardless of how long that segment lasts.
A 15% cap on a three-year segment does not mean 15% per year. It means the maximum credit over the entire three years is 15%, even if the index returns 45% cumulatively.
Caps can be structured several ways. Most common: straight percentage cap (min of 15%, actual return). Some products use tiered caps, where early-year returns face higher caps and later-year returns face lower caps. Others use spreads, where the cap is actually the index return minus a stated percentage.
The relationship between buffer and cap is mathematically tight. Higher buffers require the insurer to allocate more of their premium to protection and less to upside-generating options. That constraint is why a 10% buffer typically pairs with a 15% cap while a 20% buffer pairs with a 9% cap.
Understanding this relationship prevents the mistake of comparing products without context. A RILA advertising a 20% cap sounds superior to one offering 15%, until you see the 20% cap comes with a 5% buffer versus the 15% cap paired with a 15% buffer. In that case, the 15% cap product is likely more suitable for most clients.
Segment Terms: The Third Lever of Control
RILAs operate in segments or terms, typically one to six years. Each segment is independent. An index decline in Year 1 does not carry forward to reduce protection in Year 2.
Shorter segments (one year) give clients frequent reallocation opportunities. If you dislike the market outlook, you can step out for a year and reassess. One-year RILAs typically offer modest caps because you are only committing for 12 months.
Longer segments (three to six years) offer higher caps and better crediting terms. The insurer can invest more confidently when they know your money will stay deployed for years.
The segment term also affects buffer mechanics. A temporary market correction in a one-year segment may recover by year-end, which caps your loss. The same correction in a six-year segment might not recover until Year 3, meaning you feel the loss longer even with a buffer. For longer segments, floor structures often make more sense than buffers, because you are less certain about recovery timing.
This is a subtle point that rarely gets discussed. Most advisors focus on buffer percentage and cap size. The segment length is equally important. A 10% buffer on a one-year term is very different from a 10% buffer on a six-year term.
The 0% Floor Trap: It Is Not an FIA
Some RILAs offer 0% floors, meaning you cannot lose principal if you hold the contract to segment maturity. This sounds like an FIA. It is not.
An FIA guarantees principal throughout the contract. Interim account values may rise and fall, but your principal is locked in. A 0% floor RILA guarantees principal only at segment maturity. If you need to surrender or withdraw before maturity, you may lock in losses.
This distinction matters for clients who might need access before the segment ends. A client who bought a 0% floor RILA thinking it was principal-protected then faced an emergency at Year 2 of a three-year segment might find their account down 15%, now locked in as a permanent loss on early withdrawal.
Ask about early withdrawal implications. Many RILAs adjust the segment crediting formula if you withdraw early. Some RILAs with 0% floors use market value adjustments that can turn a “protected” 0% loss into a real loss upon early surrender.
If a client needs liquidity and psychological certainty of principal protection, an FIA is the right choice. RILAs with 0% floors provide only conditional principal protection.
Limitation: The Client Who Heard “Buffer” and Thought “Maximum Loss”
James, age 62, has $500,000 to invest. His advisor mentions a RILA with a 10% buffer. James hears “buffer” and thinks it means his maximum loss is 10%. He remembers 2008, when the market fell 37%, and feels comfortable that “at worst I lose 10%.”
His advisor should have done the calculation. In a 37% market decline:
- A 10% buffer absorbs the first 10%
- James absorbs the remaining 27%
- On $500,000, that is a $135,000 loss
James’s mental model was wrong, but it is an extremely common mental model. The word “buffer” in everyday English means protection. In RILA mechanics, a 10% buffer protects the first 10% of loss. It does not limit total loss to 10%.
This is not a minor distinction. It is the difference between a suitable recommendation and a suitability disaster.
Every RILA recommendation should include scenario analysis showing what happens in a 25%, 35%, and 40% market decline. Make the numbers concrete. Show the ending account value, not just percentages. Let the client respond. If they say “I cannot live with a $135,000 loss in that scenario,” then a RILA with a 10% buffer is unsuitable. They need a larger buffer or a different product.
This limitation applies equally to floors, but the misconception runs differently. Clients understand floors more intuitively: “I can lose up to 10%, but not more.” This matches their intuition about how financial products should work.
Client Conversation: Reframing the Mechanics
The most effective RILA conversation avoids jargon. Use analogies.
“A buffer works like a deductible in reverse. With your car insurance, you pay the first $500 of damage. With a 10% buffer, the insurance company absorbs the first 10% of market loss. You only pay if losses exceed that amount.”
“A floor works like a warranty. Your water heater comes with a warranty for five years. If it breaks in year three, the warranty pays. If the heating element fails in year six, you pay. A -10% floor says ’I’ll lose up to 10% of my money, but the insurance company takes the loss beyond that.’”
Use their specific numbers:
“If the market falls 20% and you have a 10% buffer, you lose 10% of your $500,000, which is $50,000. If the market falls 30%, you lose 20%, which is $100,000. Can you live with that scenario?”
Get them to do the math themselves:
“Let’s say the market falls 25%. With a 15% buffer, how much would you lose?”
(Client calculates: 25% minus 15% = 10%)
“Right. So your $500,000 becomes $450,000. That $50,000 loss, could you have stayed calm during that, knowing the contract would recover that once markets bounced back?”
This makes abstract mechanics personal. The client is no longer thinking about buffers. They are thinking about whether they can emotionally handle specific dollar losses under realistic market scenarios.
Key Takeaways
- A 10% buffer means losses up to 10% are free; you feel every dollar of loss beyond that. A -10% floor means you feel the first 10% of loss but nothing more. Both are protection mechanisms, but they work oppositely.
- Buffers excel at eliminating pain from normal market volatility (5 to 15% corrections). Floors excel at capping catastrophic losses (30%+ declines). Your client’s typical concern should drive the choice.
- Caps and buffers are economically linked. Higher buffers unlock lower caps. The trade-off is not negotiable. You are choosing between protection at the top (cap) or protection at the bottom (buffer).
- Segment length changes how buffers and floors behave. A one-year segment with a buffer might fully recover before year-end. A six-year segment with the same buffer might see losses persist for years. Longer segments favor floors.
- A 0% floor RILA is not an FIA. Principal protection only applies at segment maturity, not at early surrender. If early liquidity is a real need, an FIA with 100% principal protection is the safer choice.
- Always show scenario analysis for a 20%, 30%, and 40% market decline. Let your client see the actual dollar loss they would experience. If they recoil, the product does not suit them, no matter how attractive the cap or buffer sounds.
The Advisor’s Edge
RILA prospectuses are freely available. Any advisor can download them and read buffer and floor definitions. The SEC requires detailed disclosure of protection mechanics.
What separates a specialist from an advisor reading a product brochure is the ability to calculate outcomes across multiple market scenarios, explain the cap-buffer trade-off in client-specific terms, and identify when a client’s actual loss tolerance mismatches the product protection they think they are buying.
That analytical skill set is exactly what the Certified Annuity Specialist® (CAS®) program develops. The CAS curriculum covers RILA structure, protection mechanics, segment calculations, comparisons to FIAs and variable annuities, and the suitability assessment framework that turns product mechanics into client recommendations.
For more on how RILAs compare to the other major annuity category, see Fixed Indexed Annuity Crediting Methods Explained. For a broader look at how products fit into the annuity landscape, see Annuity Sales by Product Type.
Sources and Notes: RILA mechanics drawn from IBF CAS program curriculum, Chapter 18: Registered Index-Linked Annuities (RILAs). Market scenarios and buffer-floor calculations reflect standard RILA industry practices. RILA annual sales ($79.5B in 2025, up from $3.7B in 2015) per LIMRA U.S. Individual Annuity Sales Survey. This article is refreshed annually.