Fixed Indexed Annuities have set consecutive annual sales records, with total FIA sales exceeding $128 billion in 2025. The appeal is easy to explain: principal protection plus some connection to market gains. But the “some” in that sentence is where most advisor conversations go wrong.
A client hears “linked to the S&P 500” and pictures full market participation. The reality is a series of mechanical limitations, each reducing the credited interest below the actual index return. The contract language that defines these limitations (caps, participation rates, spreads, crediting methods) is not complicated, but it interacts in ways that are not obvious from reading a product brochure. Two FIA contracts linked to the same index in the same year can credit dramatically different amounts depending on how the terms combine.
This article breaks down the mechanics. It starts with the three limiting factors that control credited interest, walks through the three crediting methods that determine which index movements count, and provides a framework for comparing products when every insurer uses different terminology and different combinations. The goal is not to make FIAs sound better or worse than they are. It is to give you the precision to calculate what a client will actually earn under different market scenarios, so the conversation is built on math rather than marketing.
The Three Limiting Factors
Every FIA contract applies at least one of three mechanisms to reduce the credited interest below the actual index gain. Most contracts use two. Some use all three. Understanding each one individually is simple. Understanding how they combine is where the real analytical work begins.
Cap Rate: The Ceiling
The cap rate is the maximum credited interest for a given period, regardless of how much the index rises. If the contract has an 8% annual cap and the S&P 500 gains 25%, your client receives 8%. The 17 percentage points above the cap do not carry forward, do not accumulate, and do not appear anywhere in the contract value.
Consider a concrete example. Helen purchases an FIA with a 12% annual cap. In year one, the S&P 500 rises 8%. Helen is credited 8% because the cap is not reached. In year two, the S&P 500 rises 22%. Helen is credited 12%. The 10 percentage points above the cap vanish.
Caps are the most intuitive of the three limiting factors. They establish a hard ceiling. In strong market years, a cap can absorb a substantial portion of the index return. In moderate years, the cap may not come into play at all.
Participation Rate: The Percentage
The participation rate determines what fraction of the index gain is credited. A 70% participation rate means the client receives 70% of whatever the index gains (subject to any applicable cap).
Tom’s FIA has an 80% participation rate and no cap. The S&P 500 gains 15%. Tom is credited 12% (80% of 15%). If the S&P 500 gains 5%, Tom receives 4% (80% of 5%). The participation rate reduces every positive return proportionally.
Participation rates vary widely across contracts. Some contracts offer 100% participation with a cap. Others offer lower participation with no cap. The trade-off between these structures depends on the pattern of market returns, and neither is universally better.
Spread: The Deduction
A spread (also called a margin or asset fee) is a flat percentage subtracted from the index gain before crediting. If the contract has a 2% spread and the index gains 10%, the credited amount is 8%.
Maria’s FIA has a 2% spread and no cap. The S&P 500 gains 10%, so Maria is credited 8%. But if the S&P 500 gains only 1%, Maria receives 0% because the floor prevents negative crediting. The 2% spread consumed the entire gain.
This is where spreads behave differently from participation rates. A spread has a disproportionate impact on small gains. A 2% spread on a 3% index gain eliminates two-thirds of the return. A 70% participation rate on the same 3% gain still credits 2.1%. In low-return environments, spreads are the more punishing mechanism. In high-return environments, participation rates may reduce more in absolute terms.
When Limiting Factors Combine
Many contracts apply multiple limiting factors. The order of operations matters:
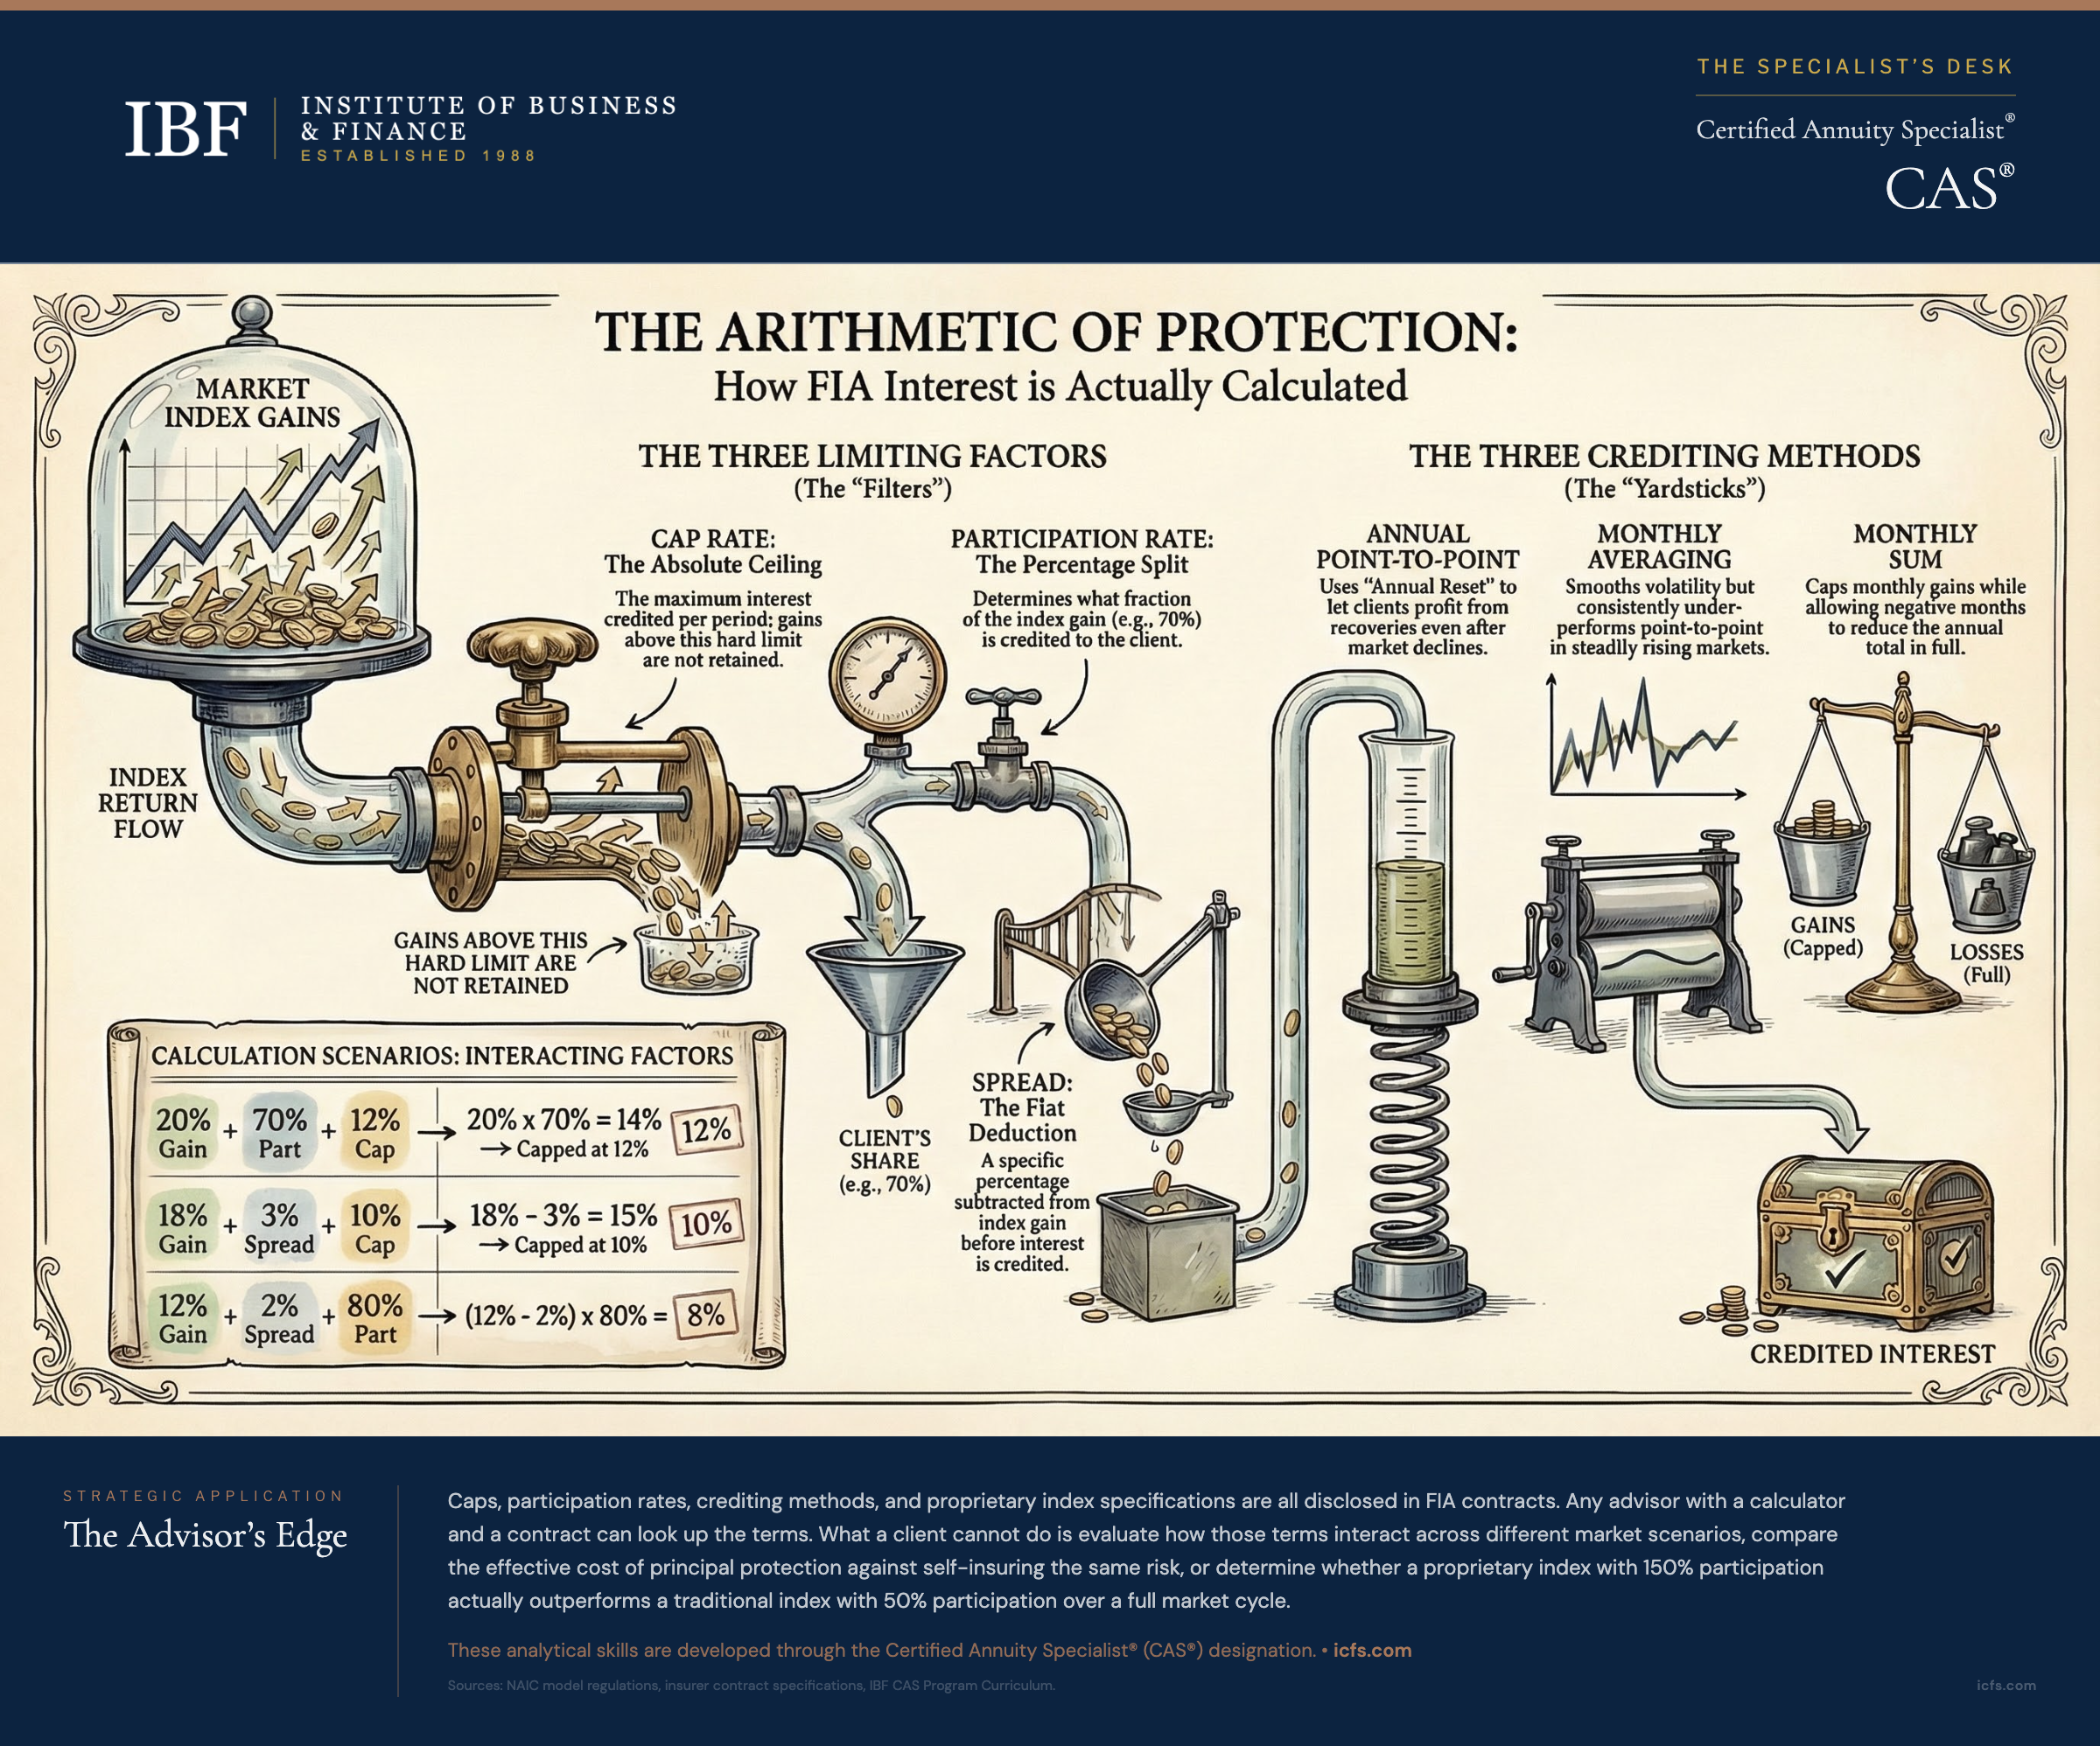
Participation rate plus cap: The index gains 20%. A 70% participation rate reduces this to 14%. A 12% cap then reduces the credit to 12%.
Spread plus cap: The index gains 18%. A 3% spread reduces this to 15%. A 10% cap then reduces the credit to 10%.
Participation rate plus spread: The index gains 12%. A 2% spread reduces this to 10%. An 80% participation rate then credits 8%.
When comparing FIA products, the only reliable method is to run the same hypothetical index scenarios through each contract’s formula. A product with a higher cap but lower participation rate may perform better or worse than a product with a lower cap but higher participation, depending on actual index returns.
The Three Crediting Methods
The limiting factors determine how much of an index gain is credited. The crediting method determines how the index gain is measured in the first place. This distinction matters more than most advisors realize.
Annual Point-to-Point with Annual Reset
The most widely used FIA crediting method. The contract measures the index level on the anniversary date and compares it to the level on the prior anniversary date. If the index is higher, the percentage gain (subject to limiting factors) is credited. If the index is lower, the floor (typically 0%) applies.
The annual reset feature is important: each year’s starting point is the previous year’s ending level. This creates a mechanical advantage after market declines.
Kevin’s FIA starts when the S&P 500 is at 4,000. After year one, the index drops to 3,600 (a 10% decline). Kevin receives 0% credit but loses nothing. After year two, the index recovers from 3,600 to 4,320 (a 20% gain). Kevin’s contract credits based on that 20% gain from the reset starting point, subject to his cap and participation rate.
Without annual reset, Kevin would need the index to exceed 4,000 before earning any credit. With annual reset, the 20% recovery from 3,600 generates credited interest even though the index has not fully recovered to its original level.
This feature tends to perform well in volatile markets where significant declines are followed by recoveries. It is less advantageous in steadily rising markets where the annual cap repeatedly truncates gains.
Monthly Averaging
Monthly averaging calculates the credited gain using the average of monthly index values rather than a single ending value. Some contracts average all 12 monthly values. Others average only the final few months.
Rachel’s FIA uses 12-month averaging. The index starts at 5,000. Monthly closing values: 5,100, 5,200, 4,900, 5,000, 5,300, 5,400, 5,200, 5,100, 5,300, 5,500, 5,600, 5,400. The average is 5,250. The credited gain is 5% (250 divided by 5,000).
Compare this to point-to-point: the December close of 5,400 represents an 8% gain. Monthly averaging produced only 5%.
Averaging is sometimes marketed as “smoothing volatility.” The more practical effect is lowering the credited interest in rising markets. In a year where the index rises steadily, averaging always produces a lower result than point-to-point because the average of the intermediate values is below the ending value. The only scenario where averaging outperforms point-to-point is when the index spikes early in the year and declines toward year-end.
Monthly Sum (Monthly Cap)
The monthly sum method applies a monthly cap to each month’s index gain, sums all twelve monthly results (positive and negative), and credits the total if it is positive. If the annual total is negative, the contract credits 0% for the year. The critical detail: negative months are not capped. They pass through in full and reduce the running total. Only positive months are subject to the monthly cap.
Robert’s FIA has a 2% monthly cap. Monthly index changes: +3%, -1%, +2%, +4%, 0%, -2%, +1%, +2%, +3%, -1%, +2%, +4%.
Without the monthly cap, the arithmetic sum of all twelve months is 17%. With the 2% monthly cap applied to positive months only: months exceeding 2% are capped at 2% (four months affected), but negative months pass through at full value. The sum: 2% + (-1%) + 2% + 2% + 0% + (-2%) + 1% + 2% + 2% + (-1%) + 2% + 2% = 11%.
The difference between 17% uncapped and 11% capped shows how much the monthly cap absorbs, but the negative months are doing real damage too. In a year with larger or more frequent monthly declines, the annual total can go negative, at which point the 0% annual floor kicks in and the client receives nothing for the year.
Some contracts do offer a per-month floor (typically 0%) that prevents negative months from reducing the total. This is a product-specific feature, not the standard design. Advisors should check whether the contract includes a monthly floor, because the difference in credited interest can be substantial. In Robert’s example, a per-month floor would have produced 15% instead of 11%.
The monthly sum method captures consistent small gains well. It punishes concentrated gains in any single month by capping them, and it exposes the client to the full impact of negative months unless the contract includes a monthly floor.
Why Crediting Method Matters More Than Cap Rate
Advisors gravitate toward comparing cap rates because caps are the easiest number to understand. But the crediting method can affect credited interest by more than the cap rate difference between two products.
Consider two contracts, both linked to the S&P 500, in a year where the index is flat through October, then rallies 12% in November and December:
Contract A: Annual point-to-point, 10% cap. Credited: 10% (the 12% gain, capped at 10%).
Contract B: Monthly averaging, 15% cap. The monthly average barely moves because 10 of 12 months were flat. The averaged gain might be 2-3%. Credited: 2-3%, despite the higher cap.
Contract B has the higher cap but credits far less because the crediting method measured the index in a way that diluted the late-year rally. This is not a flaw in Contract B. It is how averaging works. But an advisor who recommended Contract B based on its higher cap would have an unhappy client and a difficult conversation.
The lesson: always ask which crediting method was used in any illustration or comparison. Results can vary dramatically between methods using the same historical data.
What FIA Crediting Actually Costs the Client
FIA fees are not listed on a statement the way mutual fund expense ratios are. They are embedded in the crediting terms. The insurer keeps a margin by purchasing less option exposure than would be needed for full index participation, and that reduced exposure shows up as caps, participation rates, and spreads.
But there is a measurable cost. FIA crediting is based on index price return, not total return. When you own an S&P 500 index fund, you receive dividends. In recent years, the S&P 500 dividend yield has ranged from roughly 1.2% to 1.5%, and the current yield sits near 1.2%. Over longer historical periods the average is higher, but for contracts written today, the relevant figure is the current range. FIA contracts exclude dividends entirely because the option structure that provides index exposure does not include them.
Over 10 years, excluding dividends means foregoing approximately 12-15 percentage points of cumulative return before any caps or participation rates are applied. Add the limiting factors, and the gap widens further.
This is not an argument against FIAs. It is a reminder that the principal protection they provide has a real cost, and advisors who can quantify that cost are better positioned to explain the value proposition. A client who understands the full cost of principal protection can make an informed decision. A client who thinks they are “getting the market” cannot.
The Proprietary Index Question
A growing number of FIA contracts use volatility-controlled or proprietary indices rather than the S&P 500. These indices use algorithms to adjust exposure based on market conditions, typically targeting a specific volatility level (such as 5% annualized). When market volatility rises, the index reduces equity exposure and increases cash allocation.
The design rationale: lower volatility reduces the insurer’s hedging cost, which can translate to higher participation rates or higher caps for the client. A contract linked to a proprietary index might offer 150% participation where the same insurer offers only 50% participation on the S&P 500.
The catch: proprietary indices lack the decades of real-world performance data that traditional indices have. Backtested results are not the same as actual results. The volatility-targeting mechanism can cause the index to exit equity positions during sharp declines, protecting against further losses but also missing the early stages of recovery. Whether this produces better or worse outcomes depends on the specific market path, and historical backtests are constructed with perfect hindsight about what volatility levels to target.
Advisors evaluating proprietary index products should ask three questions: Who constructed the index? What is the longest period of live (not backtested) performance? And what happens to the index’s equity allocation during a sharp decline followed by a rapid recovery?
Where the Math Breaks Down
The crediting mechanics described in this article are deterministic. Given a cap, participation rate, spread, crediting method, and index performance, you can calculate the credited interest precisely. But three factors introduce uncertainty that the math alone cannot resolve.
First, caps and participation rates are not fixed for the life of the contract. Most FIA contracts guarantee the crediting terms for the first year or the first few years. After that, the insurer can adjust them, subject to contractual minimums. A contract that starts with a 10% cap may be renewed at 6% in year three. Renewal rate history varies by carrier, and past renewal behavior does not guarantee future rates.
Second, the interest rate environment drives FIA competitiveness. When rates are high, insurers earn more on the fixed-income portion of the portfolio, allowing them to purchase more options and offer better terms. When rates are low, the terms compress. An FIA purchased in a low-rate environment may offer noticeably different crediting potential than one purchased when rates are higher.
Third, the comparison to alternatives shifts with market conditions. In a sustained low-return environment, an FIA’s floor provides real protection. In a sustained high-return environment, the caps and participation rates leave substantial returns on the table. The right answer for a client depends on their specific risk tolerance, time horizon, and ability to absorb losses at the wrong time.
The Client Conversation
When a client asks “how does my money grow in an FIA?”, the worst answer is “it’s linked to the S&P 500.” That creates an expectation that no FIA contract can meet.
A better conversation starts with the trade-off: “You are trading unlimited upside for a guarantee that your account will never go backward. The contract limits how much you can earn in any given year, but it also prevents the kind of 30-40% decline that can devastate a retirement portfolio.”
Then make it specific. Pull up the contract’s crediting terms and walk through a calculation. “If the S&P 500 gains 15% this year, here is what your account would be credited under this contract’s terms.” Show the math. Then show what happens in a down year: “If the S&P 500 drops 20%, your account stays exactly where it is.”
Clients who understand the trade-off before they buy do not call angry when the S&P 500 is up 25% and their FIA credited 8%. Clients who were told they are “in the market” do call.
Key Takeaways
- Run every FIA through the same hypothetical market scenarios before recommending, using the contract’s actual cap, participation rate, spread, and crediting method to calculate credited interest rather than relying on illustrated rates.
- Compare crediting methods head-to-head: annual point-to-point with annual reset captures full-year gains and benefits from post-decline recovery, monthly averaging reduces credited interest in rising markets, and monthly sum caps truncate large monthly gains.
- Quantify the dividend exclusion cost (roughly 1.1-1.5% annually on S&P 500 linked products at current yields) when comparing FIA credited interest to index fund returns, so clients understand the true cost of principal protection.
- Examine proprietary index products with particular care: ask for live (not backtested) track records and understand what happens to equity allocation during sharp market declines.
- Set client expectations at the point of sale by walking through actual crediting calculations in both up and down markets; advisors who demonstrate the math before purchase avoid difficult conversations later.
The Advisor’s Edge
Caps, participation rates, crediting methods, and proprietary index specifications are all disclosed in FIA contracts. Any advisor with a calculator and a contract can look up the terms.
What a client cannot do is evaluate how those terms interact across different market scenarios, compare the effective cost of principal protection against self-insuring the same risk, or determine whether a proprietary index with 150% participation actually outperforms a traditional index with 50% participation over a full market cycle. These are the analytical skills that separate a credible annuity recommendation from one that relies on the brochure.
The Certified Annuity Specialist® (CAS®) designation is where financial professionals develop that level of product evaluation expertise, connecting crediting mechanics to the retirement income decisions that matter to clients on Monday morning.
For a look at the broader annuity market trends driving FIA growth, see Annuity Sales by Product Type.
Sources and Notes: Crediting method mechanics and FIA product structures described in this article reflect standard industry practices as documented in NAIC model regulations and insurer contract specifications. Specific crediting terms, caps, participation rates, and spreads vary by carrier and contract.