Opening Insight
Margaret and Robert sit down at your desk with identical financial profiles. Both are retiring at 66. Both have $1,000,000 in savings. Both need $40,000 annually from their portfolio, adjusted for inflation. Both target a 7% average annual return. They could be the same person.
Yet over the next 30 years, their outcomes will diverge dramatically. One’s portfolio will last. The other’s will be depleted before retirement ends. The difference won’t be their investment decisions, their discipline, or their luck. It will be the order in which the markets delivered their returns.
This phenomenon, called sequence-of-returns risk, is one of the most consequential concepts in retirement planning. It explains why retirees cannot simply assume that “markets always recover.” They do recover. But you cannot spend from shares you no longer own.
Core Analysis: Why the Timing of Returns Matters
The Arthur and Betty Example
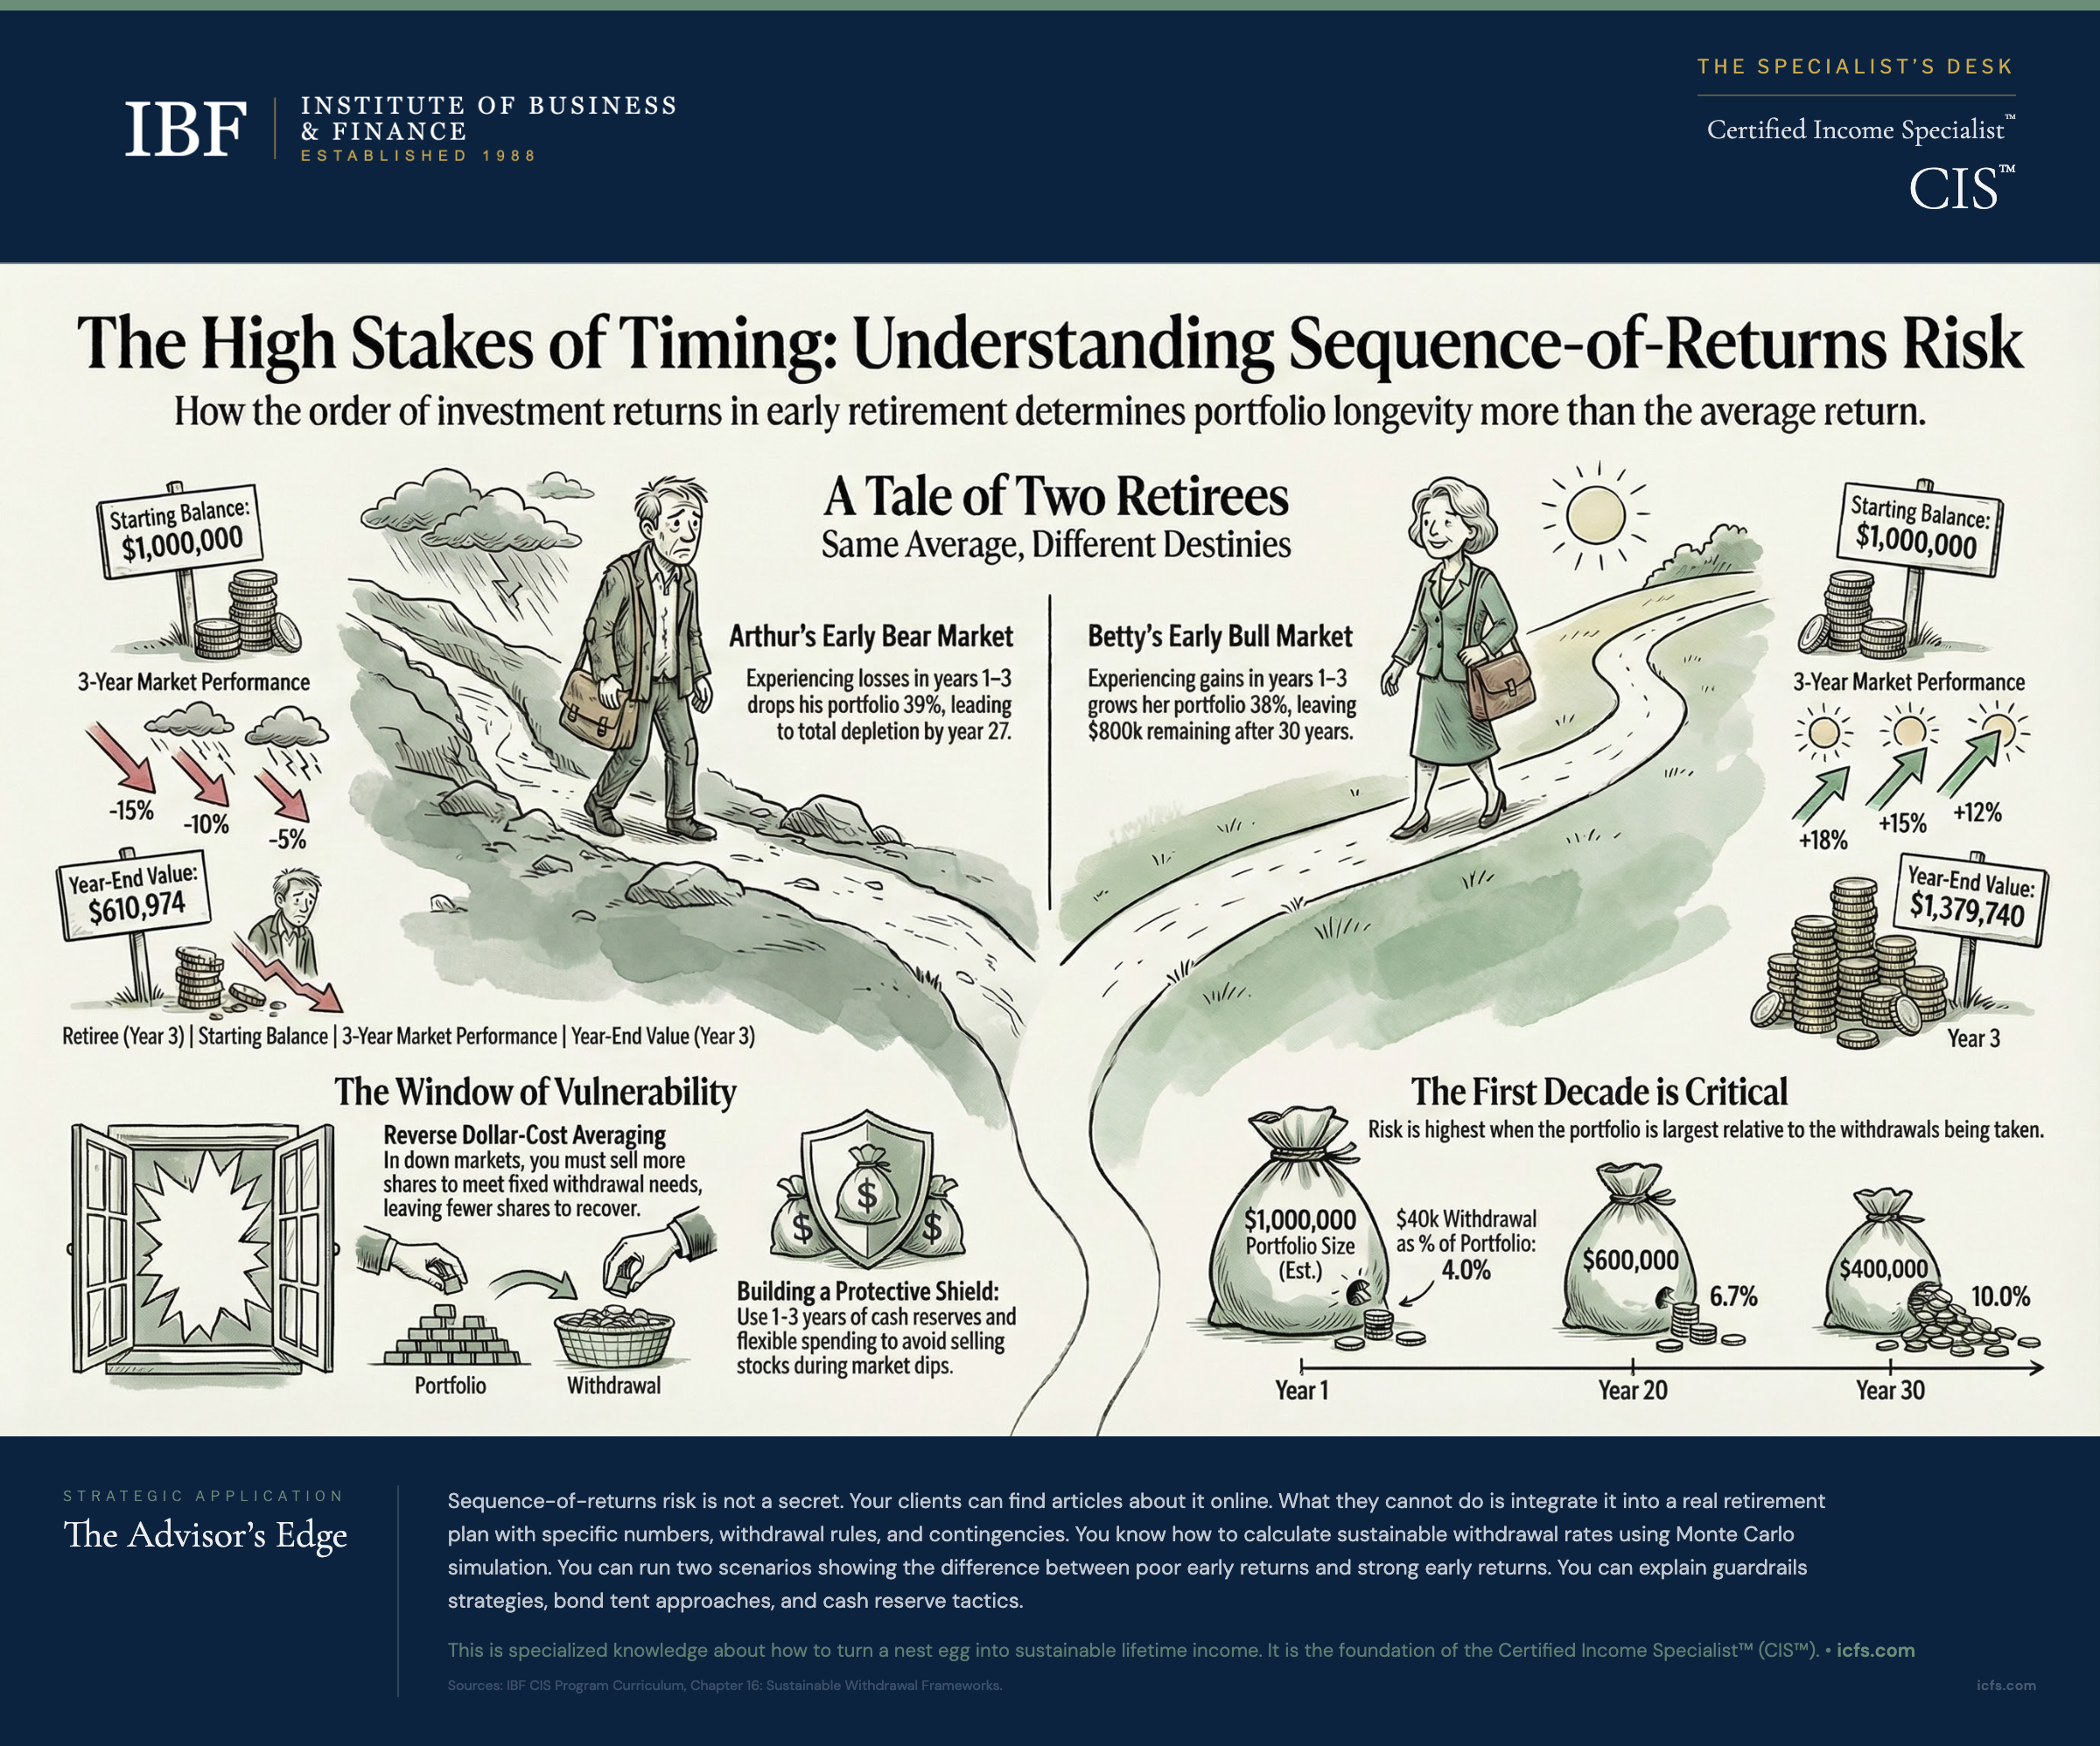
Consider Arthur and Betty, both retiring at 66 with $1,000,000 portfolios and identical spending plans: $40,000 in year one, adjusted annually for inflation (assumed 3% annually in this example). Over their 30-year retirement, both experience exactly the same average annual return: 7%. Yet they arrive at radically different outcomes.
Arthur experiences poor returns early. His portfolio loses 15% in year one, 10% in year two, and 5% in year three. The recovery comes later.
| Year | Starting Value | Return | Ending Value (before withdrawal) | Withdrawal | Year-End Value |
|---|---|---|---|---|---|
| 1 | $1,000,000 | -15% | $850,000 | $40,000 | $810,000 |
| 2 | $810,000 | -10% | $729,000 | $41,200 | $687,800 |
| 3 | $687,800 | -5% | $653,410 | $42,436 | $610,974 |
After just three years, Arthur’s portfolio has fallen 39 percent, despite withdrawing only about 12 percent of the original balance. The portfolio must now grow at extraordinary rates to recover.
Betty’s experience is the mirror image. She earns 18% in year one, 15% in year two, and 12% in year three. When poor returns arrive, they arrive near the end of her retirement.
| Year | Starting Value | Return | Ending Value (before withdrawal) | Withdrawal | Year-End Value |
|---|---|---|---|---|---|
| 1 | $1,000,000 | +18% | $1,180,000 | $40,000 | $1,140,000 |
| 2 | $1,140,000 | +15% | $1,311,000 | $41,200 | $1,269,800 |
| 3 | $1,269,800 | +12% | $1,422,176 | $42,436 | $1,379,740 |
Betty’s portfolio has grown 38 percent despite withdrawals. The larger cushion carries her through later setbacks.
Both experienced the same average return. Both made identical withdrawals. Yet Arthur’s portfolio depletes in year 27, while Betty retires with over $800,000 remaining. The difference: sequence of returns.
The Mathematics Behind the Risk
The math is straightforward but brutal. When you withdraw from a declining portfolio, you are selling shares at depressed prices. Those shares cannot participate in the recovery. A $40,000 withdrawal from a $1,000,000 portfolio represents 4 percent. That same $40,000 withdrawal from a $600,000 portfolio represents 6.67 percent. The fixed dollar amount becomes a larger and larger bite out of a shrinking balance.
Worse, this effect compounds. In year one, you might sell 100 shares at $400 each to raise $40,000. By year three, when the price has fallen, you must sell 140 shares to raise the same $40,000. The portfolio has fewer shares. When prices eventually recover, you have fewer shares participating in the recovery.
This is sometimes called “reverse dollar-cost averaging.” During accumulation, regular contributions buy more shares when prices are low, reducing your average cost. During distribution, the process reverses. Regular withdrawals force you to sell more shares when prices are low, accelerating portfolio depletion.
Why Early Years Concentrate the Risk
Sequence-of-returns risk concentrates in the first decade of retirement, and the reason is simple: that is when the portfolio is largest relative to the withdrawals.
A 20 percent decline on a $1,000,000 portfolio costs $200,000. The same 20 percent decline on a $400,000 portfolio costs only $80,000. In the first years of retirement, when the portfolio is largest, a market decline causes the most damage. In the last years, when the portfolio has been partly depleted by withdrawals, a market decline causes less absolute damage.
This creates a “window of vulnerability.” Research by Kitces, Pfau, and others suggests that the first decade of retirement is the period with the highest concentration of sequence risk. Some researchers use a 10-to-15 year window as a conservative outer bound. If a retiree survives this window without severe early declines, the remaining portfolio usually withstands later volatility because withdrawals, over time, have reduced the dollar impact. A bear market in year 28 does far less damage than a bear market in year 1.
| Retirement Year | Portfolio Size (estimated) | Initial $40,000 Withdrawal as % of Portfolio |
|---|---|---|
| 1 | $1,000,000 | 4.0% |
| 10 | $800,000 | 5.0% |
| 20 | $600,000 | 6.7% |
| 30 | $400,000 | 10.0% |
Note: This table uses the initial $40,000 withdrawal for illustrative purposes. Actual inflation-adjusted withdrawals (at 3% annually) would be approximately $52,000 in Year 10 and $94,000 in Year 30, representing a substantially higher burden on a declining portfolio.
Limitation: Where Sequence Risk Analysis Breaks Down
Sequence-of-returns risk assumes static withdrawals and no adjustments. In reality, most retirees adjust. When markets decline sharply, flexible retirees reduce spending. When markets soar, they increase it. This flexibility dramatically reduces sequence risk damage.
The analysis also assumes that early retirees have little or no guaranteed income. A retiree with $50,000 in annual Social Security and pensions has a very different exposure to sequence risk than a retiree drawing $40,000 annually from a portfolio to cover all expenses. The first retiree can treat withdrawals as supplementary and reduce them during downturns. The second cannot.
Additionally, sequence-of-returns risk math works backward from a fixed endpoint (often 30 years) and uses historical data or simulations. It does not account for real-world adjustments: major life changes, inheritances, spending changes due to health, or behavioral responses to market stress. A client who panics and shifts to cash after a 40 percent decline has done more damage than the sequence of returns itself.
Client Conversation: Making Sequence Risk Real Without Causing Fear
Here is how to explain this to a client in a way that informs without terrifying.
“Imagine two investors, Sam and Dana. Both retire with a million dollars and the same withdrawal plan. Both invest exactly the same way, and both earn the same average return over 30 years. But there is one difference: Sam happens to retire right before a difficult market period. His portfolio takes losses in years one, two, and three. When markets recover, he has fewer shares to recover with. Dana retires right before a strong market period. Her portfolio grows in those early years. When difficult years arrive later, she has a larger cushion.
This is sequence-of-returns risk. The order matters. It is not about which investments you choose or how much you earn on average. It is about when you earn it.
Here is the good news. You are not Sam or Dana. We have several ways to reduce this risk. First, we will make sure you have 1 to 3 years of spending in cash or bonds. If markets decline, you do not sell stocks at the bottom. You live on your cash. Second, we will review your plan every year and adjust if necessary. If markets have declined significantly, we might reduce discretionary spending for a year or two. You will never just watch your portfolio decline without action. Third, your Social Security and any pensions cover your essential expenses. Your portfolio is for the lifestyle above that baseline. This cushion is powerful.
Finally, if difficult years do arrive early, they usually arrive early. If you make it through the first 10 years without ruin, your remaining portfolio usually handles later downturns just fine. Early years matter most. That is where we focus protection.”
Key Takeaways
- The order of returns matters more than the average. Two retirees with identical average returns can have completely different outcomes depending on whether bear markets occur early or late in retirement.
- Early years create a window of vulnerability. The first decade of retirement is when the portfolio is largest relative to spending. Losses during this period compound negatively and can permanently reduce portfolio longevity.
- Flexibility is the most powerful mitigation. Build a plan that allows spending reductions during difficult markets. Pair this with 1-3 years of cash reserves so you do not have to sell stocks at depressed prices.
- Guaranteed income reduces the damage. If Social Security, pensions, or annuities cover essential expenses, withdrawals become discretionary. You can reduce them during poor market years without harming your baseline security.
- Rebalancing and asset allocation matter. A well-chosen portfolio with a reasonable bond allocation and annual rebalancing reduces the severity of early downturns.
- Regular monitoring prevents cascading failure. Annual reviews allow you to catch deteriorating scenarios before they become critical. Small adjustments early prevent larger ones later.
The Advisor’s Edge
Sequence-of-returns risk is not a secret. Your clients can find articles about it online. What they cannot easily do is integrate it into a real retirement plan with specific numbers, withdrawal rules, and contingencies. This is where the Certified Income Specialist™ distinction matters.
A Certified Income Specialist™ understands not just that sequence risk exists, but how to measure it, quantify it, and build specific protections against it. You know how to calculate sustainable withdrawal rates using Monte Carlo simulation. You can run two scenarios for a client (one where early returns are poor, one where early returns are strong) and show the difference. You can explain guardrails strategies, bond tent approaches, and cash reserve tactics. You can talk about the mathematics of reverse dollar-cost averaging in a way that resonates.
This is not generic retirement planning. This is specialized knowledge about how to turn a nest egg into sustainable lifetime income. It is the foundation of the Certified Income Specialist™ designation.
The skills you build in the CIS™ program (analyzing withdrawal frameworks, designing distribution strategies, and integrating guaranteed income with portfolio withdrawals) are exactly the skills a client needs when sequence risk becomes real. And for every retiree, it eventually does.
Learn more about sustainable withdrawal strategies and how to implement them for specific client scenarios in our article on The 4% Rule: What It Gets Right, What It Misses, and What to Use Instead.
Sources and Notes: Chapter 16 (Sustainable Withdrawal Frameworks), Certified Income Specialist™ course curriculum, IBF. Arthur and Betty example and guardrails methodology adapted from Chapter 16 analysis. This article is refreshed annually.