Opening Insight
You’ve seen it in every financial planning textbook and heard it at every conference for the past 25 years: the 4% rule. It’s seductive in its simplicity. Take your portfolio balance at retirement, withdraw 4% in year one, adjust for inflation each year, and you can retire with confidence. The rule has survived the dotcom crash, the financial crisis, and sustained bull markets. It feels bulletproof.
But here’s what most advisors don’t tell clients: the 4% rule was built on a specific historical dataset during a specific era. It assumed retirees had average life expectancy, no access to guaranteed income beyond Social Security, and the willingness to cut spending by 20% or more during severe downturns. None of those assumptions describe your clients. Understanding what the 4% rule actually says, and more importantly, what it doesn’t, is essential to your work as a CIS™ professional.
Core Analysis
The Origin and Reality of the 4% Rule
The 4% rule was introduced in 1994 by William Bengen, a financial advisor who studied roughly 66 years of historical market data, from 1926 through 1992. His research examined every 30-year retirement period dating back to 1926. He asked a simple question: what’s the highest initial withdrawal rate that survived even the worst historical period without depleting the portfolio?
His answer: 4%. In the worst scenario his data contained (a retiree who began retirement in 1966, right before the stagflation of the late 1970s), a 4% initial withdrawal rate adjusted annually for inflation would have survived a 30-year retirement with money left over. No 30-year period in the data had been more hostile to retirees.
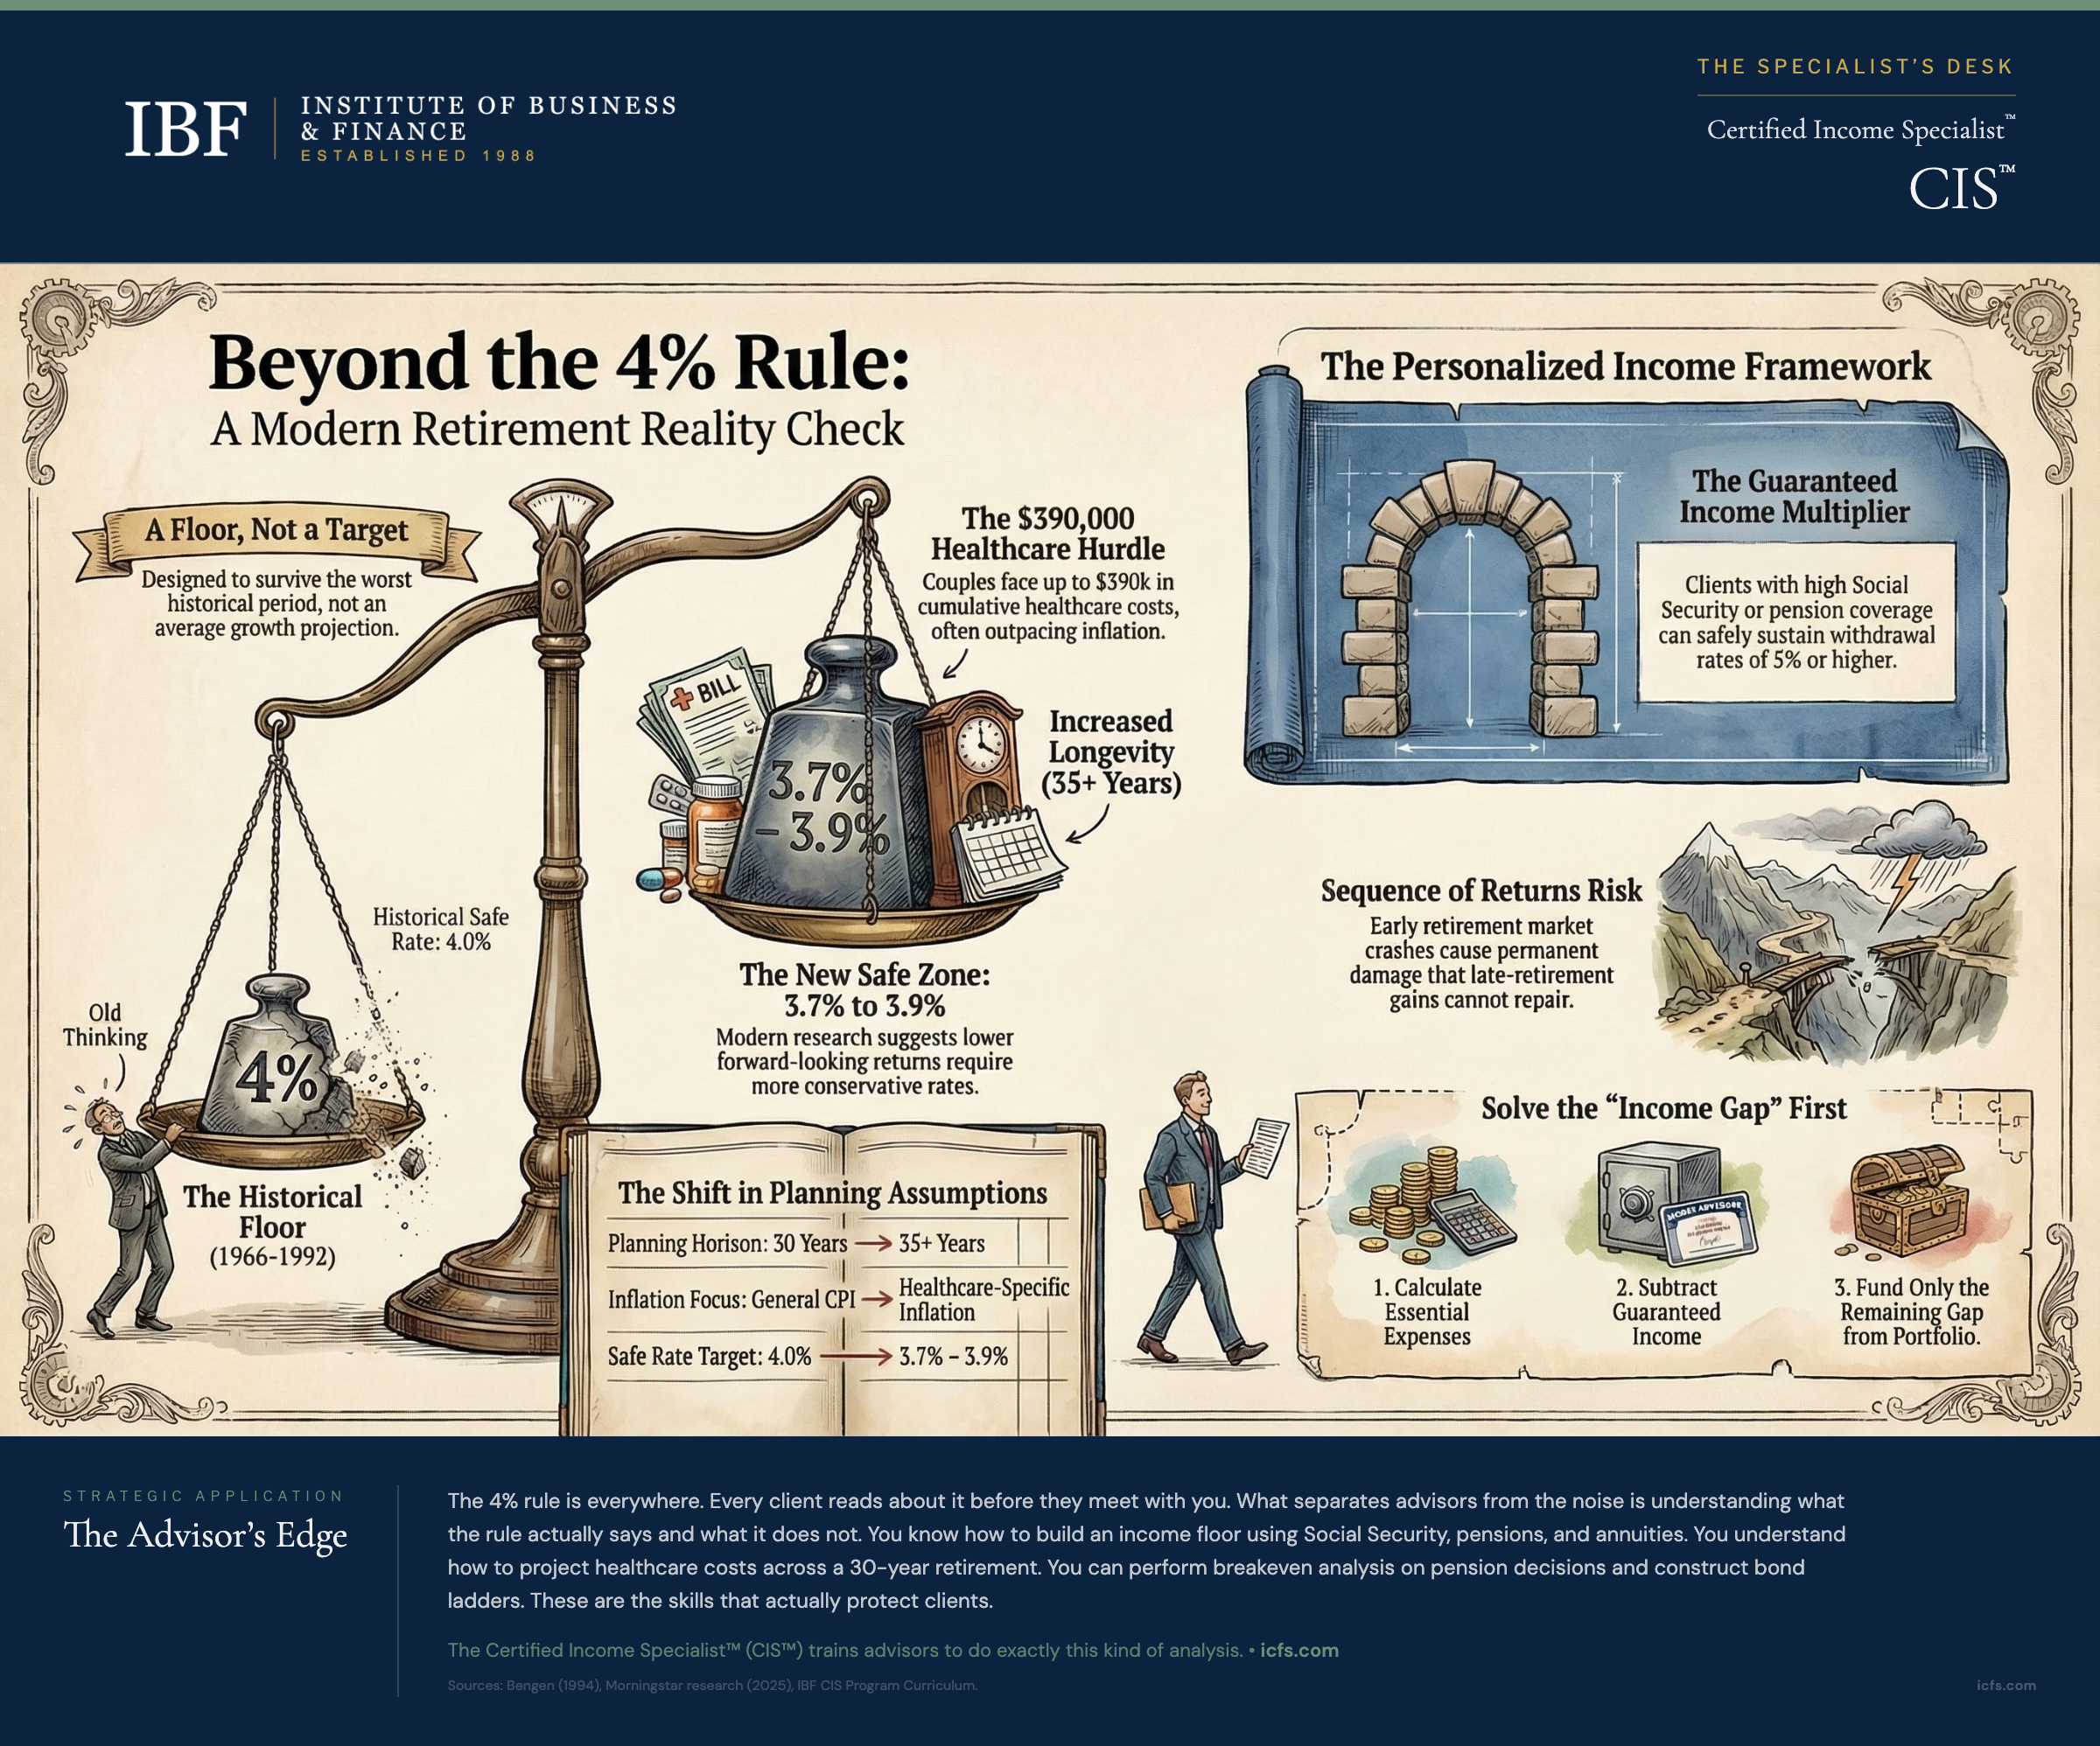
This is important to understand. The 4% rule is not a growth projection. It’s not the average safe withdrawal rate. It’s the withdrawal rate that survived the single worst historical period in nearly a century. It’s a floor, not a target.
Why the 4% Rule Resonated
The rule exploded in popularity because it gave advisors a simple answer to a terrifying question. Clients retiring with $1 million could spend $40,000 in year one with historical confidence. That clarity mattered. Advisors could back their recommendations with data. Clients could breathe easier.
The rule also aligned with other planning metrics. A 4% withdrawal rate roughly matches the yield of a diversified portfolio of bonds and dividend stocks. If your portfolio generated 4% in income annually, you weren’t touching principal. For conservative investors, that felt sustainable.
For three decades, the rule worked. Retirees who claimed 4% in 1994 and adjusted for inflation each year faced a favorable environment. Markets recovered from downturns. Real returns exceeded the historical average. The rule became gospel.
The Current Environment Changes the Conversation
Today’s conditions are fundamentally different. Consider what a retiree faces now:
Bond yields are higher than they were in 2012, when the 10-year Treasury yield was roughly 1.7 to 1.8 percent. Today’s 10-year Treasury yield stands at approximately 4.25 to 4.37 percent. Dividend yields on stocks have compressed as valuations have risen. An S&P 500 dividend yield near 1.2% gives advisors less income cushion than they had in previous decades. These headwinds appear in forward-looking analyses that project lower future returns than the historical 6-7% real (inflation-adjusted) average equities have delivered.
Longevity has increased. A 65-year-old today has a longer life expectancy than a 65-year-old in 1994. That adds years to retirement. More years means more volatility exposure. Sequence of returns risk becomes more dangerous. A severe early-retirement downturn hits earlier and harder when retirement might last 35 years instead of 30.
Healthcare costs have accelerated beyond general inflation. A 65-year-old couple can expect to spend $345,000 to $390,000 on healthcare throughout retirement, excluding long-term care. That’s not inflation-adjusted spending; that’s cumulative cost of care that rises faster than CPI.
Inflation expectations have shifted. Retirees who planned for 2.5% annual inflation in 2020 watched inflation surge past 8% in 2022, the highest level since the early 1980s, before cooling to 3.4% in 2023. If inflation averages even 0.5% higher than assumed, the impact compounds over 30 years. An extra $9,000 of eroded purchasing power might not sound like much until you realize it came from healthcare, property taxes, or insurance.
None of this means the 4% rule is wrong. It means the assumptions underlying it have changed, and advisors must adapt.
Withdrawal Rate Research Since Bengen
The academic work on sustainable withdrawal rates has exploded. Researchers at Morningstar, Vanguard, and independent analysts have published updated analyses using the same historical period Bengen studied, plus three additional decades of data.
Their findings converge on a few key points. First, the 4% rule is optimistic if you use forward-looking return projections instead of historical returns. When researchers replace 6% average equity returns with 4.5% based on current valuations and demographics, the safe withdrawal rate drops closer to 3.7-3.9%, per Morningstar’s most recent research. Second, the rule’s safety depends entirely on asset allocation. A portfolio 60% stocks and 40% bonds has different characteristics than a portfolio 80% stocks and 20% bonds. The original research assumed a middle-ground allocation, so recommendations derived from it may not apply to clients with different mixes. Third, the rule assumes no flexibility. If retirees can reduce spending by 10-20% during severe downturns, the safe withdrawal rate rises. Most retirees do reduce spending when portfolios decline, but the 4% rule assumes they don’t.
Modern research has also highlighted a critical finding: the worst 30-year period in 75 years of data might not be the worst 30-year period in the next 30 years. Markets might surprise us. Inflation might exceed current expectations. Sequence of returns risk might prove more severe than any historical period. Planning based solely on history is backward-looking.
When the 4% Rule Still Works
Despite its limitations, the 4% rule remains valid for certain clients:
Clients with significant guaranteed income that covers essential expenses can typically afford a higher withdrawal rate from their discretionary portfolio. If Social Security and pension income cover 70% of essential needs, the remaining portfolio funds only discretionary spending. Sequence of returns risk becomes less critical because essential expenses are protected. These clients can sustain 5% or higher withdrawal rates because they have built-in flexibility.
Clients with substantial assets relative to spending needs can often exceed 4% safely. The ratio matters more than the absolute percentage. A client with $2 million and $50,000 in annual spending (2.5% withdrawal rate) faces different risk than a client with $500,000 and $50,000 in spending (10% withdrawal rate). The first client has decades of cushion. The second client has limited margin for error.
Clients with strong longevity in their family history can sometimes use higher withdrawal rates if they’re in good health. Conversely, clients with health concerns that suggest shorter life expectancy may use higher rates without excessive risk. The planning horizon matters.
Clients who value flexibility and can actually reduce discretionary spending during downturns can adopt dynamic withdrawal strategies that allow for higher initial rates because the strategy adjusts in real time rather than adhering to rigid annual increases.
Limitation
The 4% rule breaks down precisely because it was designed to handle the worst historical scenario, not to optimize for typical client situations. It’s a one-size-fits-all approach in a world of individual circumstances.
Consider sequence of returns risk more deeply. The rule assumes that if average returns are, say, 6% annually, the order doesn’t matter as much. But it does. Two retirees with identical 30-year average returns of 6% can have dramatically different portfolio outcomes based solely on when those returns occurred. A retiree who experiences -20%, -10%, +30%, +8%, +10%, +12% (negative years early) faces different math than one who experiences +10%, +12%, +8%, -10%, -20%, +30% (negative years late). The first retiree sells more shares in the down years and fewer shares when prices recover, amplifying losses. This is reverse dollar-cost averaging, and it’s devastating.
The 4% rule assumes your client won’t panic when their portfolio drops 35% in year three of retirement. Most people don’t react rationally to that level of loss. They either slash spending unnecessarily (defeating the purpose of the rule) or spend normally and watch their portfolio erode faster. The psychological reality rarely matches the mathematical assumption.
Healthcare inflation has also emerged as a major limitation. The rule assumes inflation is uniform across all expense categories. But healthcare costs typically inflate faster than general CPI. A retiree whose spending is 15% healthcare in year one might find healthcare consuming 25% by year 20 if inflation patterns hold. The original rule, built on general inflation data, doesn’t account for this.
Finally, the rule assumes your client has no flexibility. In reality, most retirees adjust spending when markets decline. But the rule doesn’t assume this flexibility. It assumes spending continues to rise with inflation regardless of market performance. This conservatism is the rule’s safety mechanism, but it also means the rule is overcautious for clients who will actually adjust.
Client Conversation
Here’s how this plays out in real advisor conversations.
Sarah, 68, has $800,000 in savings, $24,000 annual Social Security income, and a small pension from her previous employer worth $12,000 annually. Her total guaranteed income is $36,000. Her essential expenses are $48,000 annually. The income gap is $12,000. A 4% withdrawal from her $800,000 portfolio is $32,000, which combined with guaranteed income, gives her $68,000 total. That’s adequate for her essential expenses plus some discretionary spending.
But here’s the reality. That $32,000 withdrawal is not actually 4% of current portfolio value every year. It’s 4% of the starting portfolio, adjusted for inflation. By year five, if markets have been average, her portfolio is slightly larger, but her withdrawal has grown to about $39,000 due to inflation adjustment. By year 15, she’s withdrawing roughly $56,000 per year from a portfolio that might be only $750,000 (if returns were modest). That’s a 7.5% withdrawal rate on current value, well above safe levels.
Or consider the reverse. If markets underperform, her portfolio has shrunk to $650,000 by year 10, but the rule still tells her to withdraw $43,000 that year (adjusted for inflation). Suddenly she’s withdrawing from a depleted base at higher rates than ever. The rule didn’t fail. Rather, the market conditions changed the equation.
The conversation with Sarah needs to include several elements. First, acknowledge that 4% serves as a starting point, not a guarantee. Second, discuss the income gap clearly: her guaranteed income covers $36,000 of $48,000 essential expenses. Third, explain that the portfolio withdrawal of $12,000 annually to close the gap is actually sustainable in perpetuity, because $12,000 is only 1.5% of her $800,000 portfolio. Fourth, identify her discretionary spending ($20,000) as the flexible portion. Her plan becomes: guaranteed income covers essentials, and the portfolio can safely support $20,000-$25,000 of discretionary spending depending on market conditions.
This reframing removes the 4% rule entirely and replaces it with the income gap framework and spending flexibility. It’s far more relevant to Sarah’s actual situation.
Consider another example. James and Patricia, both 62, have $1.2 million in savings, and both plan to work three more years. By age 65, Patricia will receive a $28,000 annual pension. James will have no pension. Their combined Social Security at 67 will be roughly $60,000. They’re asking: how much can we actually spend annually?
The 4% rule says $48,000 in year one from the portfolio. But James and Patricia are still working. They don’t need that much yet. They’re wondering whether they should save more, retire early, or something in between. The 4% rule doesn’t answer that question. What does answer it is the income gap framework. By age 65, they’ll have $28,000 pension income plus three more years of work income. By 67, their Social Security kicks in. Their essential expenses are roughly $65,000 annually (once retired). Their guaranteed income at 67 will be approximately $88,000 (pension plus Social Security). That’s more than their essentials. This means their portfolio doesn’t need to fund any essential expenses. It can fund entirely discretionary goals. This is the best position retirees can occupy.
For James and Patricia, the conversation is about discretionary spending, not portfolio sustainability. They can sustain 3-4% of portfolio value for discretionary purposes indefinitely because essential expenses are covered by guaranteed income. The 4% rule is irrelevant. The income floor framework is everything.
Key Takeaways
- The 4% rule is a historical floor, not an average. It represents the worst 30-year retirement outcome in 75 years of data. Most of your clients will face better conditions, but some will face worse. Understanding this distinction changes how you communicate the rule to clients.
- Guaranteed income changes the math entirely. A client whose Social Security and pension cover 70% of essential expenses can sustain a 5-6% portfolio withdrawal rate because the portfolio only funds discretionary spending. A client whose guaranteed income covers 20% of essential expenses needs to plan far more conservatively. Always calculate the income gap first, then determine appropriate withdrawal rates from what remains.
- Sequence of returns risk is real and damaging. Two clients with identical portfolio returns can have dramatically different outcomes based on when those returns occur. A severe downturn in the first five years of retirement causes permanent damage that later gains cannot fully repair. Plan accordingly by building cash reserves or flexible spending strategies.
- Flexibility is worth more than the difference between 3% and 4%. A client who can reduce discretionary spending by 20% during a market downturn (and actually will) can sustain higher withdrawal rates than a client who insists on constant spending. Understand your client’s actual flexibility, not their stated risk tolerance.
- Modern conditions suggest 3.5% or lower for conservative planning. When forward-looking return projections replace historical averages, when longevity extends 30+ year retirements, and when healthcare inflation accelerates, the safe withdrawal rate drops below 4%. For early retirees or clients with minimal guaranteed income, 3% or even 2.5% is more appropriate.
- Use dynamic strategies instead of static rules. Guardrails, floor-ceiling approaches, and percentage-of-portfolio withdrawals adjust automatically to market conditions. They’re more complex to explain than the 4% rule, but they align with how your clients will actually behave.
The Advisor’s Edge
The 4% rule is everywhere. Every piece of retirement software includes it. Every financial news outlet references it. Your clients read about it online before they meet with you. But what separates advisors from the noise is understanding what the rule actually says and, more importantly, what it doesn’t.
The skill that separates exceptional advisors from average ones is the ability to move beyond simplistic rules. You know how to build an income floor using Social Security, pensions, and annuities. You understand how to project healthcare costs across a 30-year retirement. You can perform breakeven analysis on pension decisions. You know how to construct bond ladders and manage sequence of returns risk. These are the skills that actually protect clients. The 4% rule is just background noise compared to this depth of knowledge.
The Certified Income Specialist™ designation from the Institute of Business & Finance trains advisors to do exactly this kind of analysis. Not to memorize the 4% rule, but to understand the principles that make retirement income sustainable. The income gap framework, the income floor concept, the five retirement risks, and the integration of guaranteed and variable income sources are where real planning happens.
For your next client approaching retirement, skip the 4% rule. Instead, calculate their essential expenses. Identify their guaranteed income sources. Find the gap. Determine how their portfolio will close that gap. Discuss which expenses flex when markets decline. From there, recommend a withdrawal strategy that matches their actual situation, not a rule built for a 30-year planning horizon in a historical dataset. That’s what Monday morning looks like for a CIS™ professional.
For a closer look at why the timing of market declines matters more than average returns, see Sequence-of-Returns Risk: Why Early Retirement Years Matter Most.
Sources and Notes: Withdrawal rate sustainability analysis drawn from Bengen (1994), Morningstar research (2025), and CIS syllabus materials on retirement income fundamentals and sustainable withdrawal frameworks. This article is refreshed annually.