Every advisor has heard it. A client walks in with a Morningstar printout, points to a five-star fund, and says, “This one has beaten the market for ten years. Why would I buy anything else?”
It is one of the most common assumptions in investing, and one of the most expensive. The regulatory disclaimer that “past performance does not guarantee future results” appears on every fund prospectus, every marketing piece, every performance report. Yet most investors, and more than a few advisors, still behave as though recent returns are the best signal of what comes next. The question worth examining is not whether the disclaimer is legally required. The question is whether five decades of data support it, and what that data actually tells us about where to look for skill.
The Arithmetic That Cannot Be Argued
Before examining any data, it helps to start with math. In 1991, Nobel laureate William Sharpe published a short paper with an argument so clean it borders on obvious. Before costs, the return of all investors collectively must equal the market return. For every dollar that outperforms, another dollar must underperform. This is not a theory. It is accounting.
The implication is direct. After costs, the average actively managed dollar must underperform the average passively managed dollar by precisely the amount of costs incurred. An active fund charging 1% more in total costs than an index fund must beat the index by 1% annually just to break even. Over 20 years, that compounding cost gap becomes enormous.
Sharpe’s insight reframes the question. The debate is not really about whether markets are efficient. It is about whether any subset of active managers can consistently overcome their cost disadvantage. And on that question, the long-term data is remarkably consistent.
What Five Decades of Performance Data Show
Study after study reaches the same conclusion: most active managers underperform their benchmarks after fees. The pattern holds across time periods, market segments, and geographies.
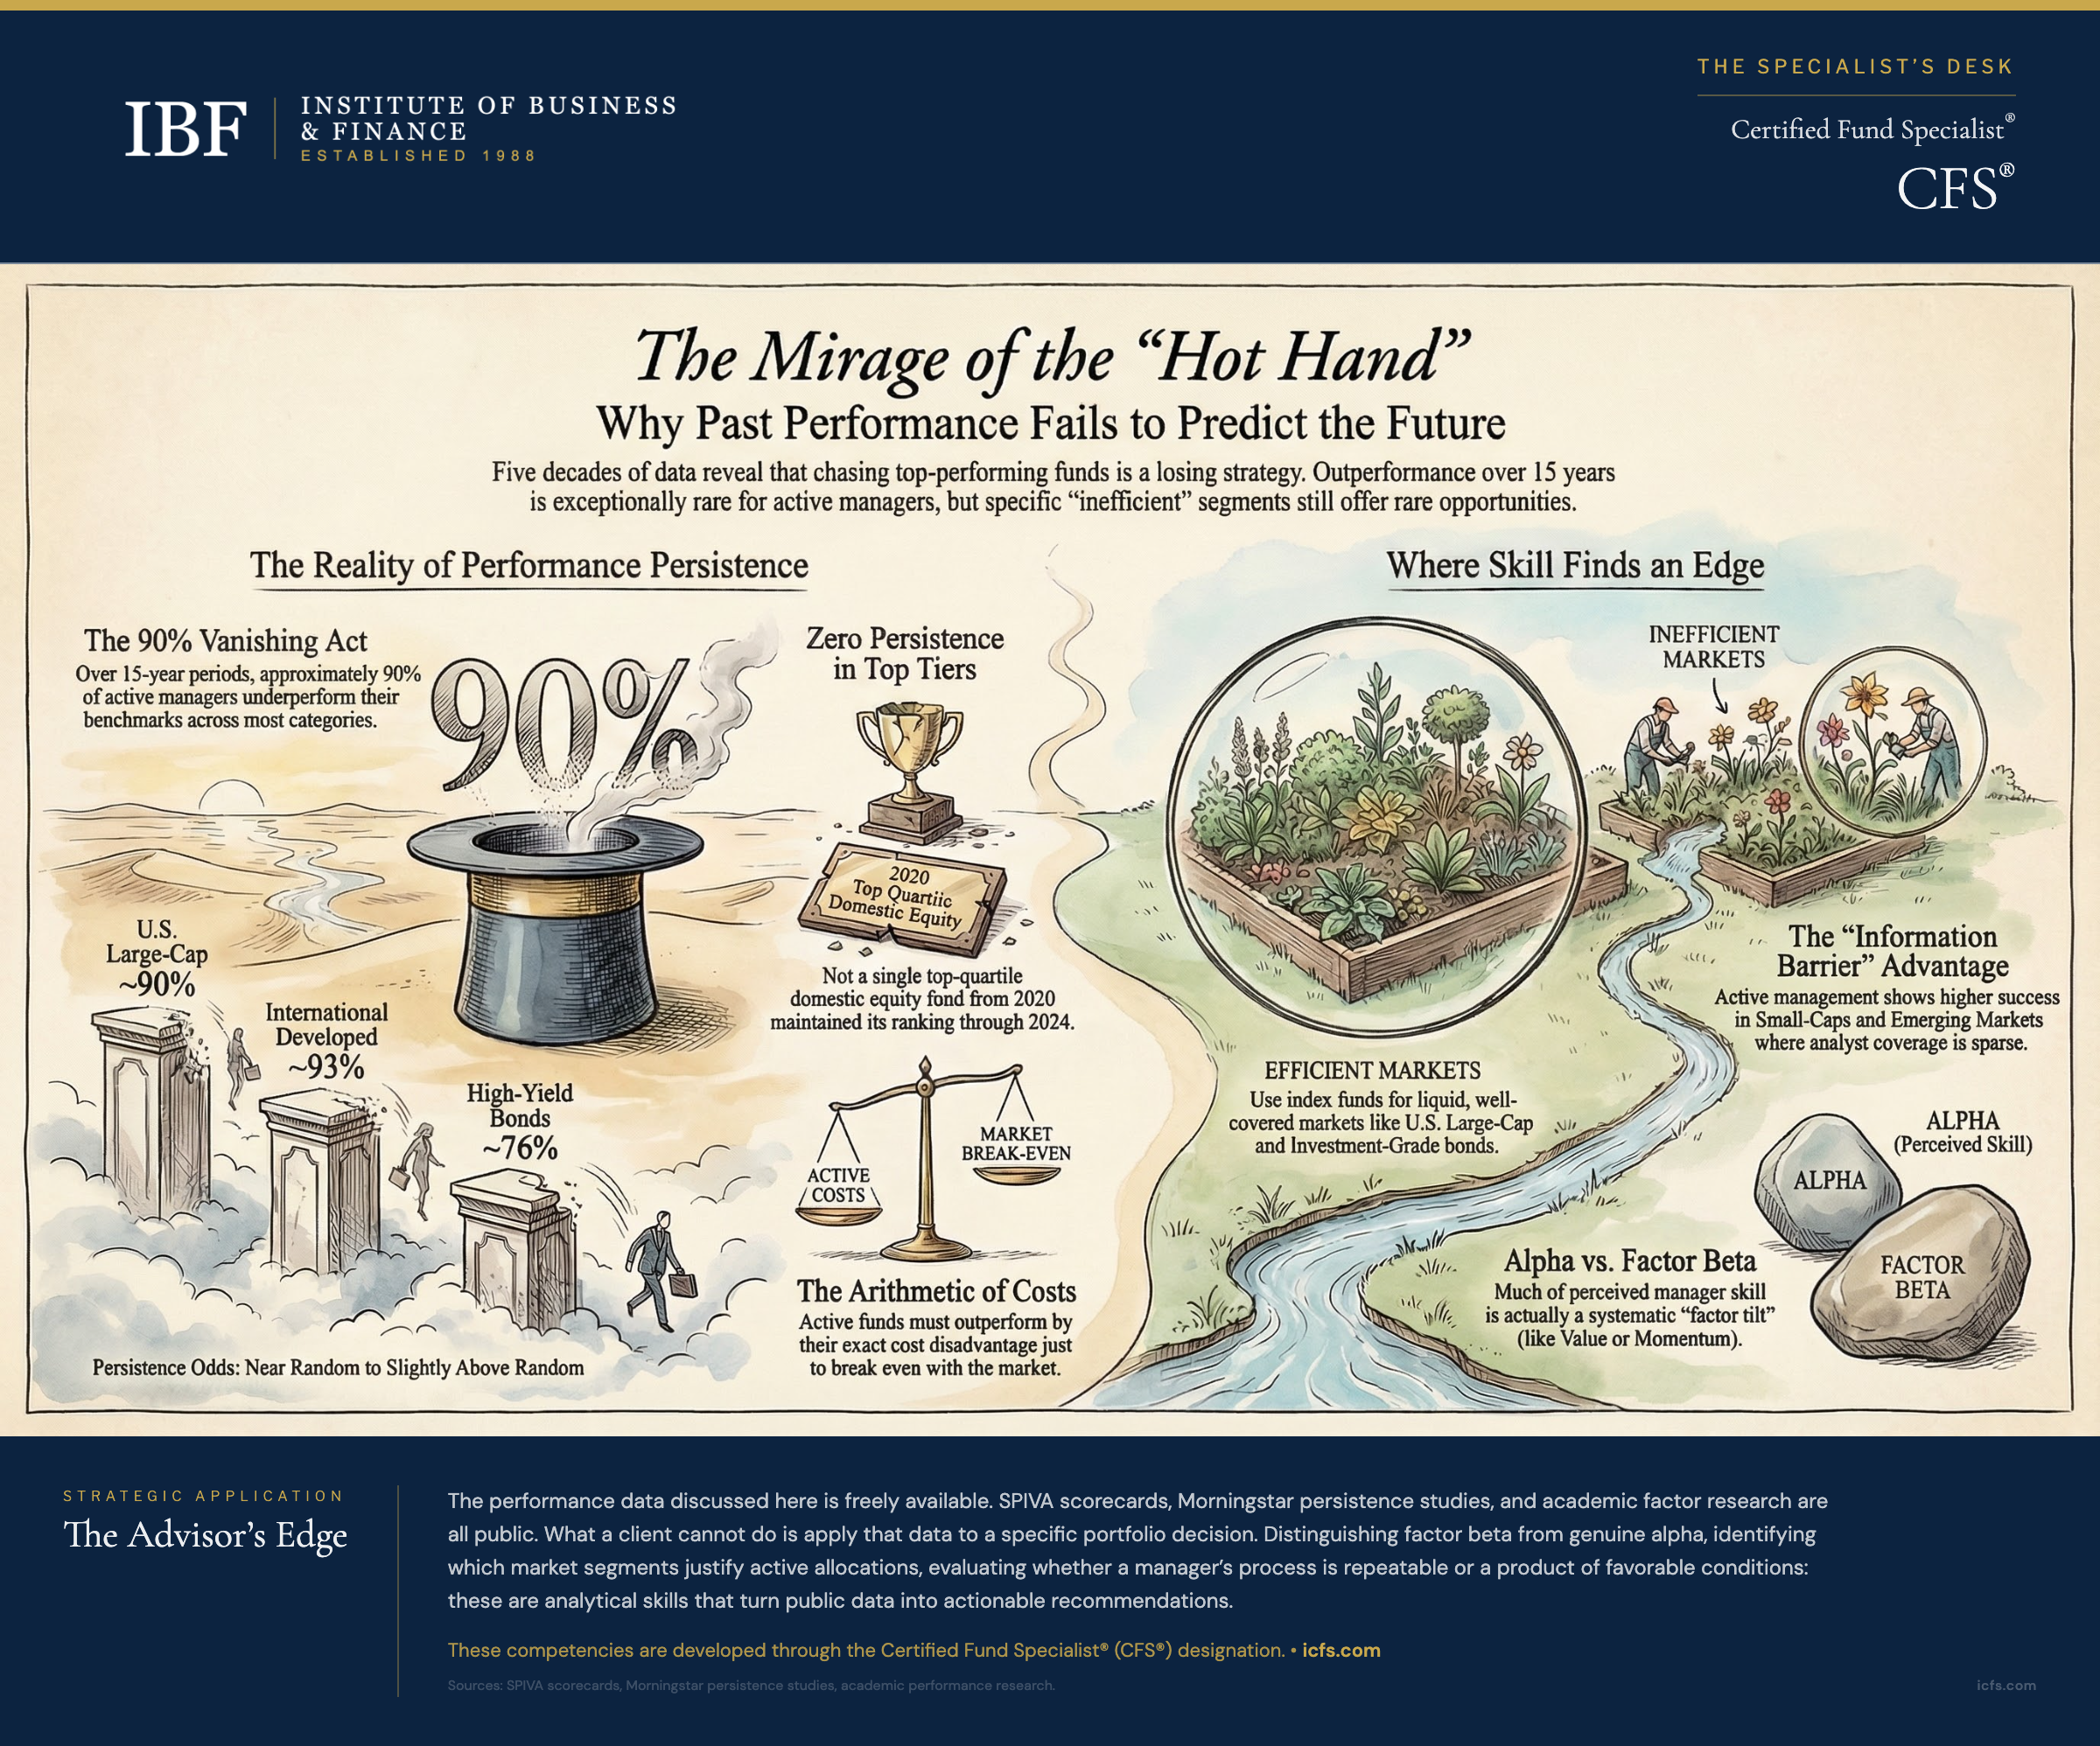
The most striking finding involves time horizon. In any single year, roughly 35% to 50% of active managers beat their benchmark depending on the category and market conditions (the long-run average for U.S. large-cap is closer to 36%). That sounds like reasonable odds. But extend the measurement period and the numbers collapse. Over 10-year windows, the percentage of outperformers drops below 25% in most categories. Over 15-year periods, it falls to roughly 10% or less. Costs compound relentlessly, and each year the manager must clear the same hurdle again.
Survival bias makes the picture look better than it actually is. Funds that perform poorly often merge into stronger siblings or liquidate entirely, disappearing from the historical record. Studies that account for these “dead” funds show even worse aggregate results for active management. The fund your client cannot find in the database anymore is probably not missing because it did too well.
The Persistence Problem
Here is the finding that matters most for advisors making forward-looking recommendations: top-quartile funds in one period have little better than random odds of remaining in the top quartile in subsequent periods.
This is the core of the prediction problem. If past winners reliably became future winners, performance chasing would be a legitimate strategy. Instead, the data is actually worse than a coin flip. The SPIVA Persistence Scorecard for year-end 2024 found that not a single top-quartile domestic equity fund from December 2020 remained in the top quartile over the subsequent four years. Among large-cap funds specifically, zero maintained top-quartile status from 2022 through 2024, compared to a 6.25% random expectation. There is some weak persistence at the extremes, particularly among the worst performers, who tend to stay bad. But among the top group, regression to the mean is not just present; it is nearly absolute.
The table below summarizes the pattern across major fund categories:
| Category | % Active Funds Underperforming Benchmark (15-Year, SPIVA 2024) | Top-Quartile Persistence |
|---|---|---|
| U.S. Large-Cap | ~90% | Near random |
| U.S. Small-Cap | ~91% | Near random |
| International Developed | ~93% | Near random |
| Emerging Markets | ~90% | Near random |
| Investment-Grade Bond | ~90% | Near random |
| High-Yield Bond | ~76% | Slightly above random |
The numbers tell a blunt story. Over 15 years, roughly 9 out of 10 active managers underperform across nearly every category. The gap between segments that seemed wide in the industry narrative (large-cap vs. small-cap vs. emerging markets) is actually narrow when measured at this time horizon. Where the picture does shift is at shorter windows and in how the underperformance expresses itself, which matters for how advisors build portfolios.
Why Beating the Market Is So Difficult
Several forces explain why consistent outperformance is rare, and why it has likely gotten harder over time.
Markets are intensely competitive. The vast majority of trading volume comes from institutional investors, all analyzing the same earnings reports, the same economic data, the same management commentary. For one professional to gain an advantage, another professional must make a mistake. In U.S. large-cap stocks, where thousands of analysts cover the same companies, that edge is vanishingly small.
Costs create a structural headwind. Active funds carry higher expense ratios, higher trading costs, and cash drag from maintaining liquidity buffers. These costs must be overcome before the manager delivers any value to the investor. A fund with a 1.2% expense ratio competing against an index fund at 0.03% starts each year in a 1.17% hole.
Success attracts capital, and capital dilutes returns. A nimble small-cap manager running $200 million can buy and sell positions without moving prices. Give that same manager $5 billion after a strong run and the strategy changes fundamentally. Larger positions take longer to build, impact costs rise, and the manager is forced into larger-cap stocks that offer less opportunity. Some of the best-performing strategies in history destroyed their own edge by attracting too much money.
Information advantages have narrowed. Regulation Fair Disclosure (Reg FD), adopted in 2000, requires companies to release material information to all investors simultaneously. The days when a well-connected analyst could get an early read on earnings are largely over. Superior analysis remains possible, but competitors will eventually replicate any edge that becomes visible.
Where the Evidence Tilts Toward Active Management
The 15-year aggregate data makes the case against active management look airtight across every category. But there is a subtlety the table does not capture: the path to that 15-year number differs by market segment, and those differences matter for portfolio construction.
Over shorter horizons of one to three years, active managers in small-cap and emerging markets show higher outperformance rates than their large-cap counterparts. In 2024, for example, roughly 70% of active small-cap funds outperformed their benchmarks. That advantage erodes over longer periods as costs compound, but it suggests these segments contain more exploitable inefficiency at any given point. The question for advisors is whether they can identify the managers who capture that shorter-term edge repeatedly.
Small-cap stocks receive far less analyst coverage than large-caps. A manager willing to conduct original research on companies that institutional investors overlook can find genuine mispricings. The edge is real, but it is smaller and less durable than the industry narrative suggests. Benchmark selection also matters: active small-cap managers fare better against the Russell 2000 (which includes unprofitable companies that drag down index returns) than against the more stringent S&P SmallCap 600 with its profitability screen.
Emerging markets have the structural ingredients for active management to work: information asymmetries, corporate governance concerns, varying accounting standards, and index construction issues. Dedicated local managers with original research capabilities have genuine advantages over foreign competitors. But the aggregate 15-year data shows that these advantages do not translate into widespread outperformance. Active share analysis, which measures how much a portfolio actually differs from its benchmark, becomes critical here. Many emerging market funds marketed as “active” are really closet indexers charging active fees for index-like exposure. Filtering for high active share narrows the field to managers who are actually trying to do something different.
High-yield bonds reward security-level credit analysis in ways that investment-grade bonds do not. Default prediction, recovery analysis, and issuer-specific research create differentiation opportunities. Municipal bonds, with tens of thousands of individual issuers and a fragmented dealer market, also give an edge to managers with established relationships and dedicated research teams. High-yield is the one equity-adjacent category where the long-run underperformance rate (~76%) is noticeably lower than others, suggesting the analytical edge in credit markets is more durable.
Investment-grade bonds and U.S. large-cap equity sit at the other end of the spectrum. Returns in these segments are driven by broad factors (duration, credit quality, market beta) that index funds replicate cheaply. The typical active manager adds little value after fees.
The Factor Complication
The rise of factor investing has complicated the performance persistence question further. Academic research has identified characteristics associated with higher expected returns: value, momentum, quality, low volatility, and size. Much of what was once attributed to manager skill turns out to be explainable by factor exposures.
A fund manager who consistently tilts toward small-cap value stocks may appear to outperform through skill when the real driver is a systematic factor premium anyone can access at low cost through a factor ETF. Separating genuine alpha (returns from true skill) from factor beta (returns from known risk premiums) is one of the most important analytical tasks in manager evaluation.
Factor premiums themselves are not free money. Value stocks underperformed growth dramatically for much of the 2010s. Momentum strategies can crash suddenly during market reversals. Quality and low volatility factors lag in speculative rallies. The investor who abandons a factor tilt during a painful drawdown may miss the subsequent recovery. Patience and discipline matter as much as selection.
This has practical implications for how advisors evaluate track records. A manager who outperformed over the last decade may have done so by loading up on momentum or quality factors that happened to perform well. That tells you something about the manager’s factor exposure, but it tells you very little about whether they will outperform in the next decade when different factors may dominate.
Where This Breaks Down
The evidence favoring passive investing is strongest in liquid, well-covered markets during normal conditions. It is less definitive during periods of extreme dislocation, where rapid credit deterioration, sudden liquidity withdrawal, or structural market breakdowns can create mispricings that skilled active managers exploit.
The March 2020 market environment is a recent example. Investment-grade bond ETFs traded at discounts of 3% to 7% below their NAVs, with some individual funds exceeding 5% on peak days, because underlying bond prices had gone stale. Active bond managers who recognized the dislocation and bought during the panic captured significant returns that index funds, which mechanically track their benchmarks, could not. Similarly, distressed debt managers who correctly identified companies that would survive versus those that would default generated returns unavailable through any passive vehicle.
For a client whose portfolio is entirely indexed, these episodes represent missed opportunities. The question is whether those opportunities justify the persistent cost drag of active management during the 95% of the time when markets function normally. For most clients, the answer is no. For high-net-worth investors with longer time horizons and the ability to tolerate periods of underperformance, a selective allocation to active management in less efficient segments may be worth the cost.
The Client Conversation
When a client asks why you are not chasing last year’s top performer, the conversation is really about expectations and evidence.
Start with what the client already knows intuitively. They would not assume that last year’s best-selling car is guaranteed to be next year’s best-seller. They understand that a restaurant’s great review last month does not guarantee a great meal tonight. Investment performance works the same way, except the data is even more definitive.
Then move to what makes your recommendation different. You are not picking funds based on recent returns. You are matching the strategy type to the market characteristics. In segments where the evidence shows active management adds value, you look for managers with a clear, repeatable process and reasonable fees. In segments where the evidence shows indexing wins, you capture market returns at minimal cost. That framework does not change based on who had the best year.
The strongest version of this conversation acknowledges the client’s instinct rather than dismissing it. “You are right that skill exists. The question is where it shows up and how to identify it before the fact, not after. That is exactly what we are doing.”
Key Takeaways
- Over 15-year periods, roughly 90% of active managers underperform their benchmarks in most categories, with the worst results in U.S. large-cap equity and investment-grade bonds, so default to indexing these segments.
- Top-quartile performance in one period has near-random odds of persisting into the next period, making backward-looking fund selection unreliable as a primary strategy.
- Active management shows better short-term results in less efficient markets (small-cap, emerging, high-yield, municipal bonds), though long-run aggregate data converges toward similar underperformance rates; the case for active in these segments rests on shorter-horizon edges and careful manager selection, not on dramatically different 15-year outcomes.
- Separate factor exposure from true alpha when evaluating any manager’s track record; much of what looks like skill is often a systematic risk premium available at lower cost through factor ETFs.
- Reserve active management allocations for market segments where the evidence supports it, and insist on managers with clear processes, reasonable fees, and genuine active share.
- Frame the client conversation around evidence and process rather than recent returns; acknowledge that skill exists while showing where it actually shows up in the data.
The Advisor’s Edge
The performance data discussed in this article is freely available. SPIVA scorecards, Morningstar persistence studies, and academic factor research are all public. Any client with an internet connection can find the headline that most funds underperform.
What a client cannot do is apply that data to a specific portfolio decision. Distinguishing factor beta from genuine alpha, identifying which market segments justify active allocations, evaluating whether a manager’s process is repeatable or a product of favorable conditions, sizing active positions relative to their probability of success: these are analytical skills that turn public data into actionable recommendations.
The Certified Fund Specialist® (CFS®) designation is where financial professionals develop that analytical framework, connecting performance evidence to portfolio construction decisions that serve clients on Monday morning.
For a closer look at how fund costs compound over time and erode the returns clients actually keep, see How Expense Ratios Compound Over Time.
Sources and Notes: Performance persistence data reflects patterns documented in SPIVA scorecards and academic research on active management. Specific percentages represent general ranges from multiple studies and may vary by exact time period and methodology. This article is refreshed every 18 months or upon major methodology changes.