Most advisors have a general opinion about active versus passive management. What many lack is a systematic process for translating that opinion into specific fund selections across different market segments. They know the SPIVA data. They know most active managers underperform. They may even know which categories offer better odds for active strategies. But when it comes time to fill an allocation slot in a client portfolio, the process often breaks down into habit, familiarity, or whatever fund came across their desk most recently.
That gap between knowledge and implementation is where portfolios quietly lose value. An advisor who defaults to indexing everything leaves potential alpha on the table in less efficient markets. An advisor who defaults to active management everywhere pays unnecessary costs in segments where the evidence overwhelmingly favors passive. The solution is not a single philosophy applied uniformly. It is a decision framework that asks the right question for each allocation: given the evidence for this market segment, what selection approach gives this client the best probability of a good outcome after costs?
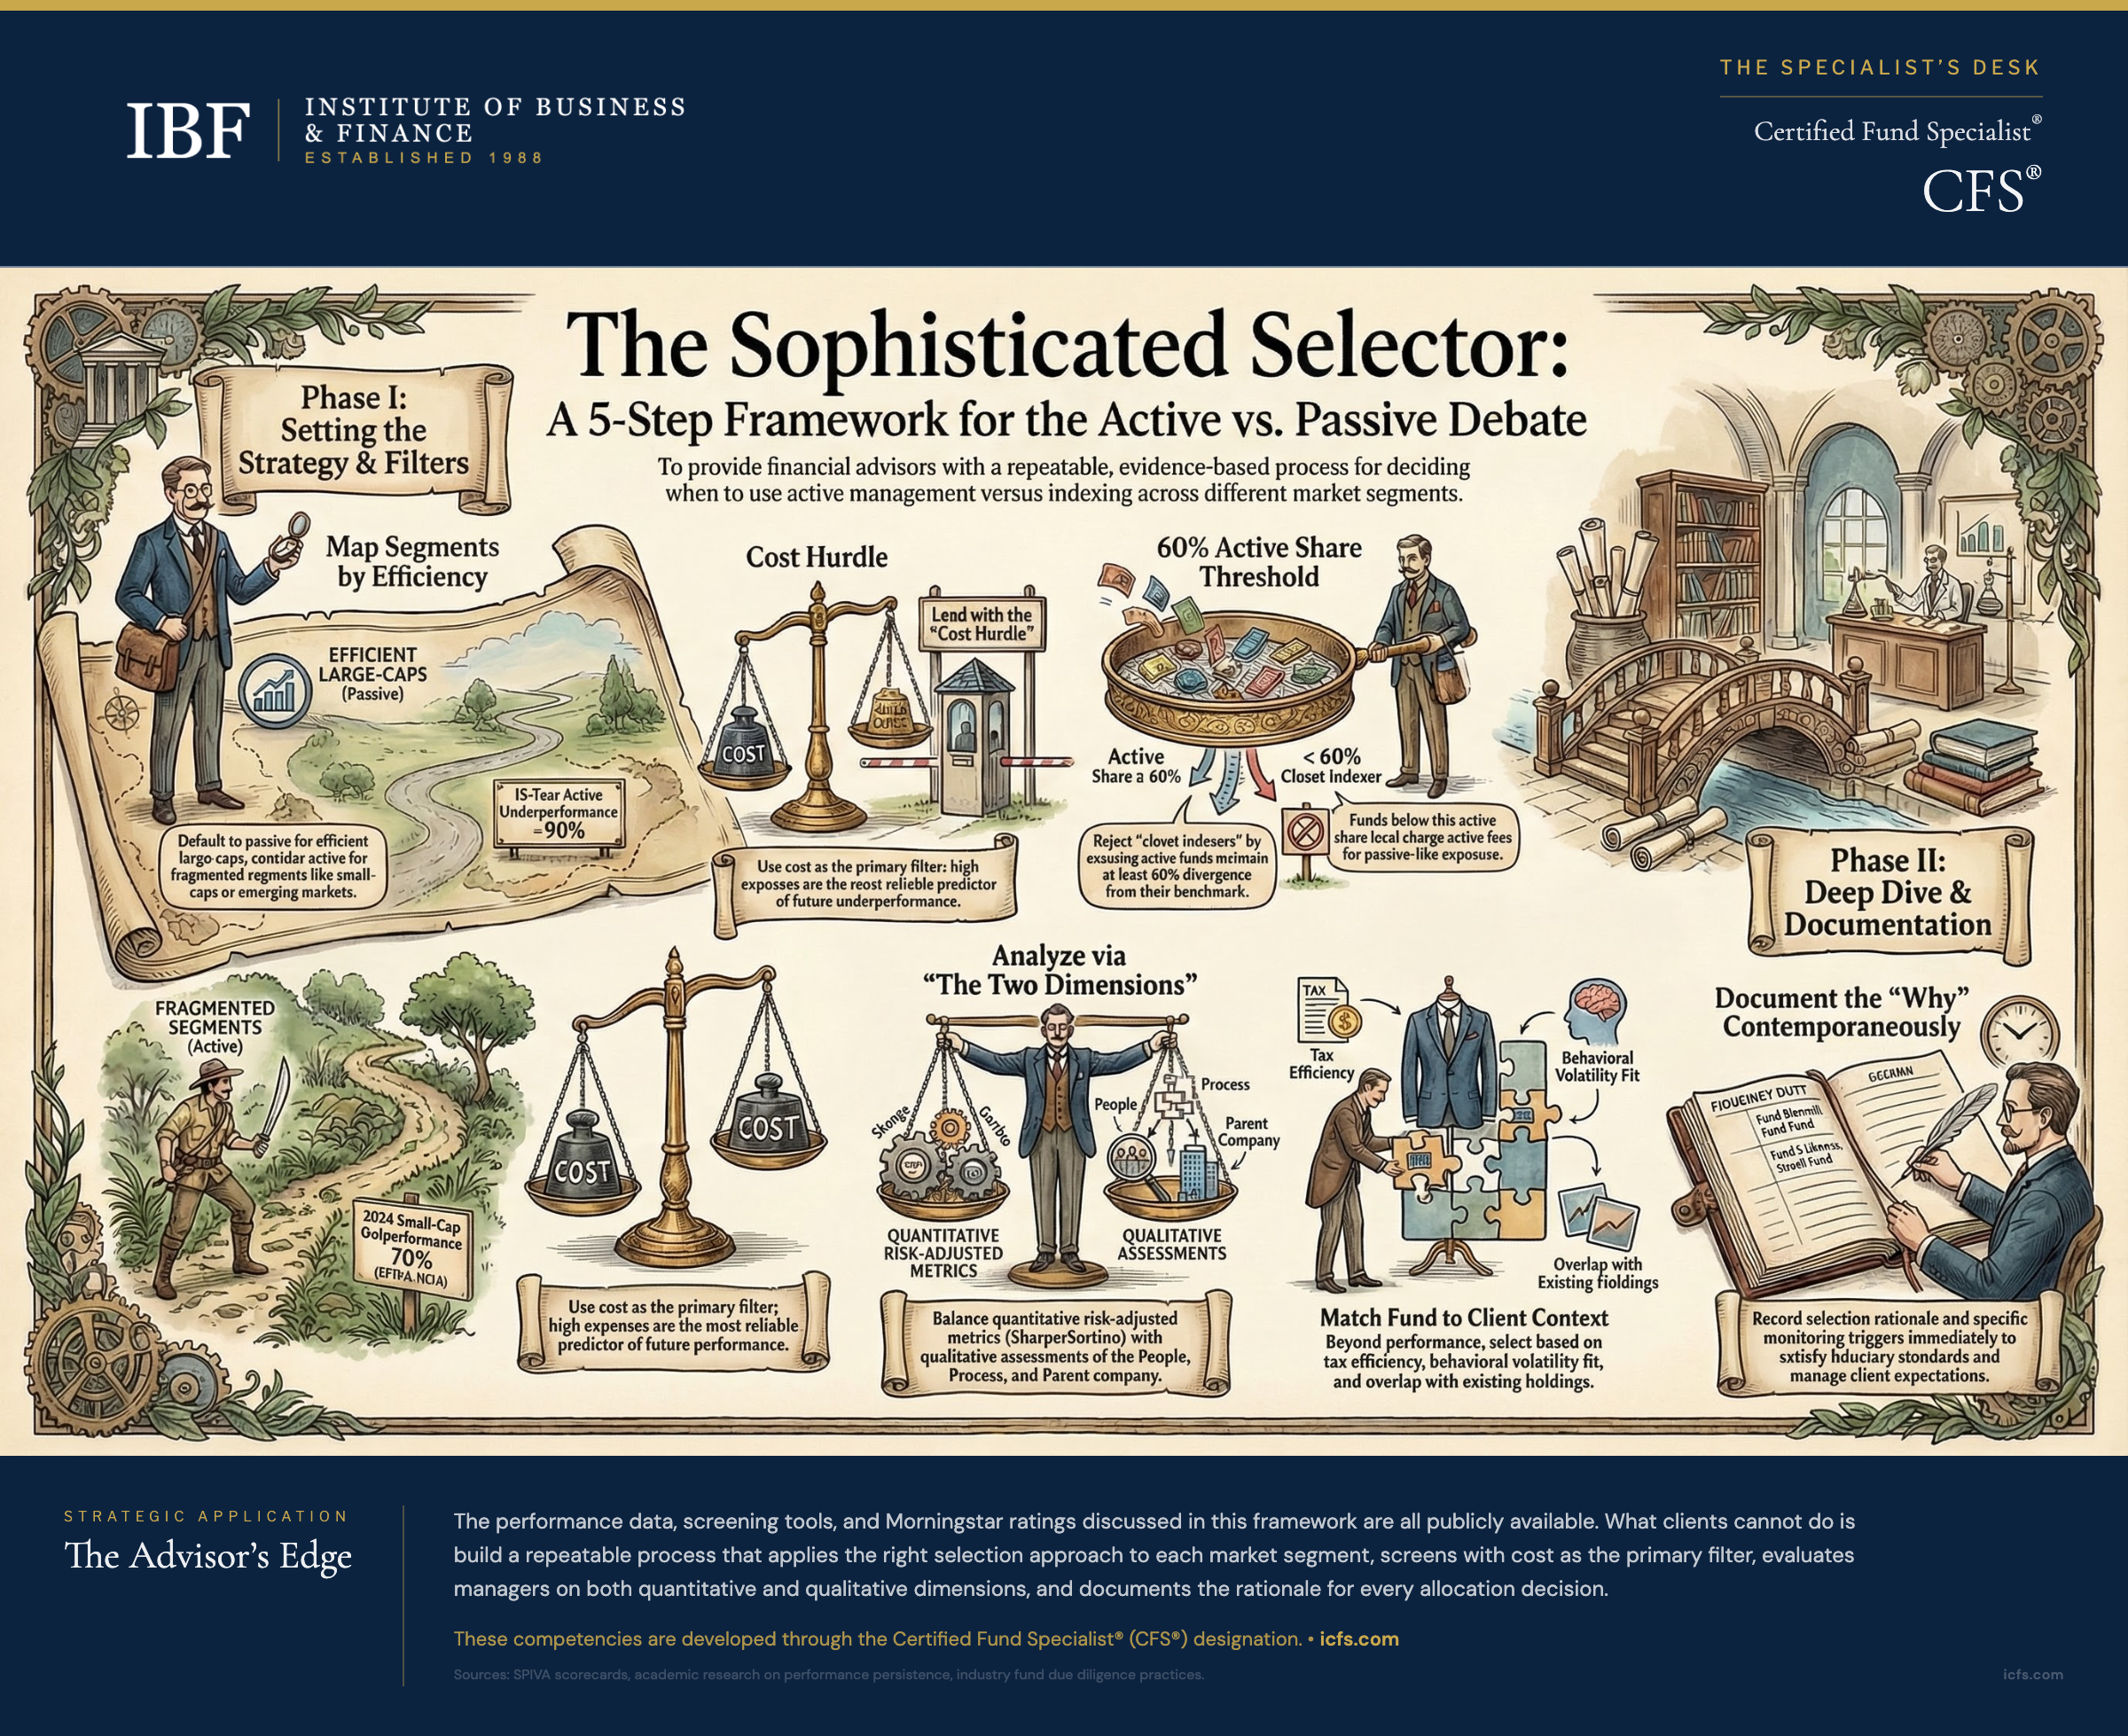
This article provides that framework. It draws on decades of performance evidence and applies it to the practical five-step process of screening, analyzing, comparing, selecting, and documenting fund choices. The goal is not to settle the active/passive debate but to make the debate irrelevant by replacing ideology with evidence-based, segment-specific decisions.
Step One: Map Market Segments to Selection Approach
Before looking at a single fund, decide how you will approach each market segment in the portfolio. This decision should be made at the allocation level, not the fund level, and it should be documented before the search begins.
The evidence supports a spectrum of approaches based on market efficiency:
Default to passive in U.S. large-cap equity, investment-grade bonds, and other highly efficient segments. Over 15-year periods, roughly 90% of active managers underperform in these categories. The cost hurdle is too high, the information advantage too small, and the odds too unfavorable to justify active management as the starting position. An advisor who indexes these segments is not being lazy. They are following the evidence.
Consider active selectively in small-cap equity, emerging markets, high-yield bonds, and municipal bonds. These segments have structural characteristics that create analytical edges: less analyst coverage, information asymmetries, credit complexity, or market fragmentation. Active managers in these segments show better short-term outperformance rates than their large-cap counterparts. Over the shortest horizons of one year, active small-cap managers have recently outperformed at above-average rates. (In 2024, 70% of actively managed small-cap funds outperformed the S&P SmallCap 600, the highest outperformance rate in SPIVA's 24-year history, per the Year-End 2024 SPIVA Scorecard.) The advantage narrows significantly at three years and largely disappears at longer horizons, where roughly 90% of small-cap funds also underperform their benchmarks. But the year-to-year path is different from large-cap, and that variability creates opportunity for advisors who can identify repeatable skill early and monitor closely.
Use the middle ground where factor strategies or core-satellite approaches make sense. Factor investing (value, momentum, quality, low volatility) occupies the space between pure active and pure passive. A systematic value tilt through a factor ETF captures a premium that was once available only through active managers, at a fraction of the cost. For clients who want some active exposure without full active fees, these strategies provide a structured compromise.
The critical point: this mapping happens once, gets documented in the investment policy, and applies to every client with a similar risk profile. You are not making the active/passive decision from scratch for every fund purchase. You are applying a framework that has already been decided based on evidence.
Step Two: Screen with Cost as a Primary Filter
Screening reduces thousands of funds to a manageable shortlist. The most reliable predictor of future relative performance is not past returns, star ratings, or manager reputation. It is cost.
William Sharpe’s 1991 arithmetic still holds: after costs, the average actively managed dollar must underperform the average passively managed dollar. The collective shortfall, in aggregate, equals the cost advantage of passive strategies. A fund with a 1.2% expense ratio competing against an index fund at 0.03% starts each year in a 1.17% hole. Over 20 years, that compounding gap is enormous. This does not mean every expensive fund is bad or every cheap fund is good. It means cost is a structural headwind that compounds relentlessly, and any screening process that ignores it is starting with a disadvantage.
For passive allocations, screening is simple. Filter by category, set a maximum expense ratio at or near the category floor, confirm adequate assets and liquidity, and verify that tracking error is minimal. The differences between competing index funds in the same category are small, and cost is the tiebreaker. A large-cap index fund at 0.03% will almost certainly outperform one at 0.15% over any meaningful period, all else being equal.
For active allocations, screening requires more criteria but should still lead with cost. Set an expense threshold at or below the category median. Funds above the median must overcome a larger hurdle just to match index returns, and the data shows that few consistently do. After cost, apply minimum track record length (three years at minimum, five preferred), minimum asset size (to ensure operational stability and adequate resources), and share class availability appropriate for the client.
A well-designed screen reduces a universe of 2,000 funds to 10 to 30 candidates. If the screen produces more than 30, tighten it. If it produces fewer than 10, loosen it. The goal is efficiency: eliminate clearly unsuitable options quickly so analytical time is spent on funds that have a reasonable chance of being selected.
The Benchmark Trap
One screening subtlety that catches advisors: benchmark selection affects everything downstream. Active small-cap managers fare better against the Russell 2000 (which includes unprofitable companies that drag down index returns) than against the S&P SmallCap 600 with its profitability screen. If you screen active small-cap funds against the wrong benchmark, you will overstate their value proposition. Match the benchmark to the actual opportunity set, not to the one that makes the comparison look most favorable.
Step Three: Analyze Across Two Dimensions
Screening identifies candidates. Analysis determines which ones deserve a place in the portfolio. This step divides into quantitative analysis (what happened) and qualitative analysis (why it happened and whether it is likely to continue). Both are required. Neither alone is sufficient.
Quantitative: Beyond Raw Returns
Raw returns are the starting point, not the conclusion. A fund that returned 15% sounds impressive until you learn the benchmark returned 20%. Context comes from risk-adjusted metrics, peer comparison, and time period analysis.
Examine returns across multiple periods (one, three, five, and ten years where available). Consistent performance across periods suggests a repeatable process. Exceptional results concentrated in a single year suggest timing or luck.
Risk-adjusted metrics matter more than raw returns for fund comparison. The Sharpe ratio measures excess return per unit of total risk. The Sortino ratio focuses on downside deviation, ignoring the upside volatility that investors do not mind. Alpha measures return above what the fund’s market exposure would predict. Information ratio measures active return relative to tracking error. No single metric captures everything. Use multiple metrics together, and be skeptical of any fund that looks good on one measure but poor on the rest.
Rolling returns reveal consistency that point-to-point returns obscure. A fund with strong five-year returns might have earned those returns in a single exceptional year followed by four mediocre ones. Rolling three-year returns calculated monthly show whether outperformance persists or clusters.
Downside capture ratio deserves special attention. A fund with 80% downside capture falls 8% when its benchmark falls 10%. Combined with upside capture, these ratios reveal whether a manager protects capital during stress (which matters to real clients) or simply rides the market in both directions (which index funds do cheaper).
Qualitative: People, Process, Parent
Numbers describe the past. Qualitative analysis assesses whether the past is likely to repeat.
People: Who manages the fund? What is their tenure? How are decisions made within the team? A fund built around a single star manager carries key person risk. A fund built around a systematic process implemented by a team may transition more smoothly when personnel change. Long tenure provides a track record to evaluate, but it also means a succession event is approaching. Ask about the plan.
Process: How does the fund make investment decisions? Can the team articulate a clear, internally consistent philosophy? A repeatable, systematic process is more likely to deliver consistent results than one that shifts with market conditions. If the team cannot explain in plain language what they do differently and why it should work, that is a red flag.
Parent: Who owns the fund company? Some fund organizations prioritize investment excellence. Others prioritize distribution and asset gathering. When a fund company is acquired, examine whether investment teams maintain autonomy and whether fee structures change. Parent company financial stress can lead to cost-cutting that degrades research budgets and talent retention.
Red Flags That Override Good Numbers
Certain patterns warrant disqualification regardless of how strong the quantitative profile looks:
Style drift, where a fund’s actual holdings diverge from its stated category, undermines the portfolio role the fund was selected to fill. A “growth” fund holding 30% value stocks may be excellent, but it is not filling the intended allocation.
Rapid asset growth in capacity-constrained strategies. A nimble small-cap manager running $200 million can buy and sell positions without moving prices. That same manager running $5 billion after a strong run faces fundamentally different market impact constraints.
Performance that seems too consistent. In strategies with volatile underlying assets, returns that show minimal drawdowns and steady positive months may indicate smoothing, misvaluation, or worse.
Step Four: Select by Matching Fund to Client
The analysis narrows candidates to finalists. Selection applies judgment to match the fund to a specific client’s circumstances. The “best” fund in objective terms may not be the right fund for a particular client.
Tax situation changes the calculus. A fund with excellent pre-tax returns but high distributions is less attractive in a taxable account than a more tax-efficient alternative with slightly lower pre-tax performance. ETFs generally provide structural tax advantages over mutual funds in taxable accounts through their in-kind creation and redemption mechanism, which allows appreciated securities to transfer out without triggering gains for remaining shareholders.
Existing holdings create overlap considerations. A client with concentrated employer stock in one sector needs a fund that avoids loading up on that same sector.
Behavioral fit matters. Some clients respond poorly to volatility even when their stated risk tolerance supports it. A fund that is objectively superior but psychologically intolerable will be sold at the worst possible time. Matching the fund’s volatility profile to what the client can actually endure is part of the selection process.
For active allocations specifically, one additional check is essential: active share. This measures how much a portfolio actually differs from its benchmark. Many funds marketed as “active” are closet indexers, charging active fees for index-like exposure. A fund with active share below 60% (based on Cremers and Petajisto's foundational research) is not doing enough differently from the index to justify its cost premium. If you are paying for active management, confirm that you are actually getting it.
Step Five: Document Everything Before You Move On
Documentation is not a compliance afterthought. It is part of the process. Regulation Best Interest (for broker-dealer representatives) and the Investment Advisers Act fiduciary standard (for RIAs) both strongly support a practice of maintaining contemporaneous records. This is the most defensible evidence that you exercised reasonable diligence, care, and skill in making recommendations.
Document at the time of selection, not retroactively. Memory fades; written records do not. The documentation should address what selection criteria you defined before the search, which alternatives you considered and why you rejected them, what quantitative and qualitative analysis you performed, why this fund serves this client’s specific requirements, how cost factored into the decision, and what monitoring triggers will prompt future review.
This documentation practice also serves a practical purpose beyond compliance. When a fund underperforms six months later and the client asks why you selected it, the contemporaneous record reminds both of you what the rationale was. Without documentation, every past decision gets evaluated with hindsight, which is unfair to the decision and unhelpful to the relationship.
Setting Monitoring Criteria at Selection
The time to define monitoring criteria is when you select the fund, not after problems emerge. “I will watch this fund closely” is not a monitoring plan. “This fund goes on the watch list if it underperforms its peer category median for three consecutive quarters” is.
Performance triggers prompt enhanced analysis, not automatic sales. Qualitative triggers (manager departure, organizational changes, regulatory actions) may warrant faster action. The distinction matters: monitoring identifies situations that require attention. The sell decision framework determines whether attention requires action.
Where the Framework Breaks Down
No selection process is perfect. This framework has limitations that are worth naming.
The historical evidence that drives segment mapping (index these categories, consider active in those) reflects aggregate data. Within any segment, the range of outcomes is wide. Some active large-cap managers do outperform persistently. Some active small-cap managers destroy value. Aggregate data sets the default, but individual analysis can override it when the evidence is strong enough.
Factor investing complicates the active/passive binary. A fund that systematically tilts toward value, momentum, or quality is not truly passive (it deviates from the market portfolio) and not truly active (it follows rules rather than manager discretion). Much of what was once attributed to manager skill turns out to be explainable by factor exposures available at low cost through ETFs. Separating genuine alpha from factor beta is one of the most important analytical tasks in manager evaluation, and one of the hardest.
Market conditions matter. The evidence favoring passive investing is strongest during normal market conditions in liquid, well-covered segments. During periods of extreme dislocation (severe credit deterioration, sudden liquidity withdrawal, structural market breakdowns), skilled active managers can exploit mispricings that index funds cannot. The March 2020 environment, when investment-grade bond ETFs traded at discounts of 3% to 7% below their NAVs, is a recent example. These episodes are rare, and for most clients, the persistent cost drag of active management during the 95% of normal conditions outweighs the occasional dislocation opportunity.
The Client Conversation
When a client asks “why are we using an index fund here but an active manager there?” the answer is not complicated, but it needs to sound deliberate rather than arbitrary.
The framework translates to a simple explanation: “We use the approach that gives you the best odds in each part of your portfolio. In U.S. large-cap stocks, where thousands of professionals are analyzing the same companies, the evidence strongly favors low-cost indexing. In smaller companies and less followed markets, we can find managers who earn their fees through research that most investors do not have access to. Your portfolio is not all-active or all-passive. It is built segment by segment based on where the evidence points.”
That conversation works because it is specific, evidence-based, and positions you as someone who has thought carefully about portfolio construction rather than defaulting to a one-size-fits-all approach. It also pre-empts the inevitable follow-up when a client reads about a hot fund and asks why you did not buy it. The framework provides the answer before the question is asked.
Key Takeaways
- Map each portfolio segment to an active, passive, or factor-based approach before looking at individual funds, based on the market efficiency evidence for that category, and document the rationale in the investment policy.
- Lead every fund screen with cost: set expense thresholds at or below category medians for active funds and near the category floor for passive, since cost is the most reliable predictor of future relative performance.
- Combine quantitative analysis (risk-adjusted returns, rolling performance, downside capture) with qualitative assessment (people, process, parent) for every active fund candidate, and reject any candidate with style drift, rapid asset bloat, or suspiciously smooth returns.
- Check active share before selecting any active fund; a fund with active share below 60% is a closet indexer charging active fees for index-like exposure.
- Document selection criteria, alternatives considered, and rationale at the time of selection (not retroactively), and set specific monitoring triggers that define when a fund goes on the watch list.
- Frame the client conversation around segment-by-segment evidence rather than an all-or-nothing philosophy, which positions the portfolio as deliberately constructed and pre-empts questions about individual fund performance.
The Advisor’s Edge
The performance data, screening tools, and Morningstar ratings discussed in this article are all publicly available. Any client with an internet connection can look up a fund’s expense ratio, star rating, and five-year return.
What a client cannot do is integrate that information into a systematic selection process. Deciding which market segments justify active management based on efficiency evidence, screening for cost-adjusted quality rather than past performance, evaluating manager skill through factor decomposition and qualitative analysis, matching fund characteristics to a specific client’s tax situation and behavioral profile, and documenting the rationale in a way that satisfies both the client relationship and regulatory requirements: these are the professional competencies that separate a fund recommendation from a fund guess.
The Certified Fund Specialist® (CFS®) designation is where financial professionals develop that analytical framework, connecting performance evidence to portfolio construction decisions that serve clients on Monday morning.
For a closer look at the evidence behind the active/passive debate, see Does Past Performance Predict Future Results?.
Sources and Notes: The fund selection framework presented in this article synthesizes evidence from SPIVA scorecards, academic research on performance persistence, and industry best practices for fund due diligence. Specific performance patterns referenced reflect long-term studies and may vary by exact time period and methodology.