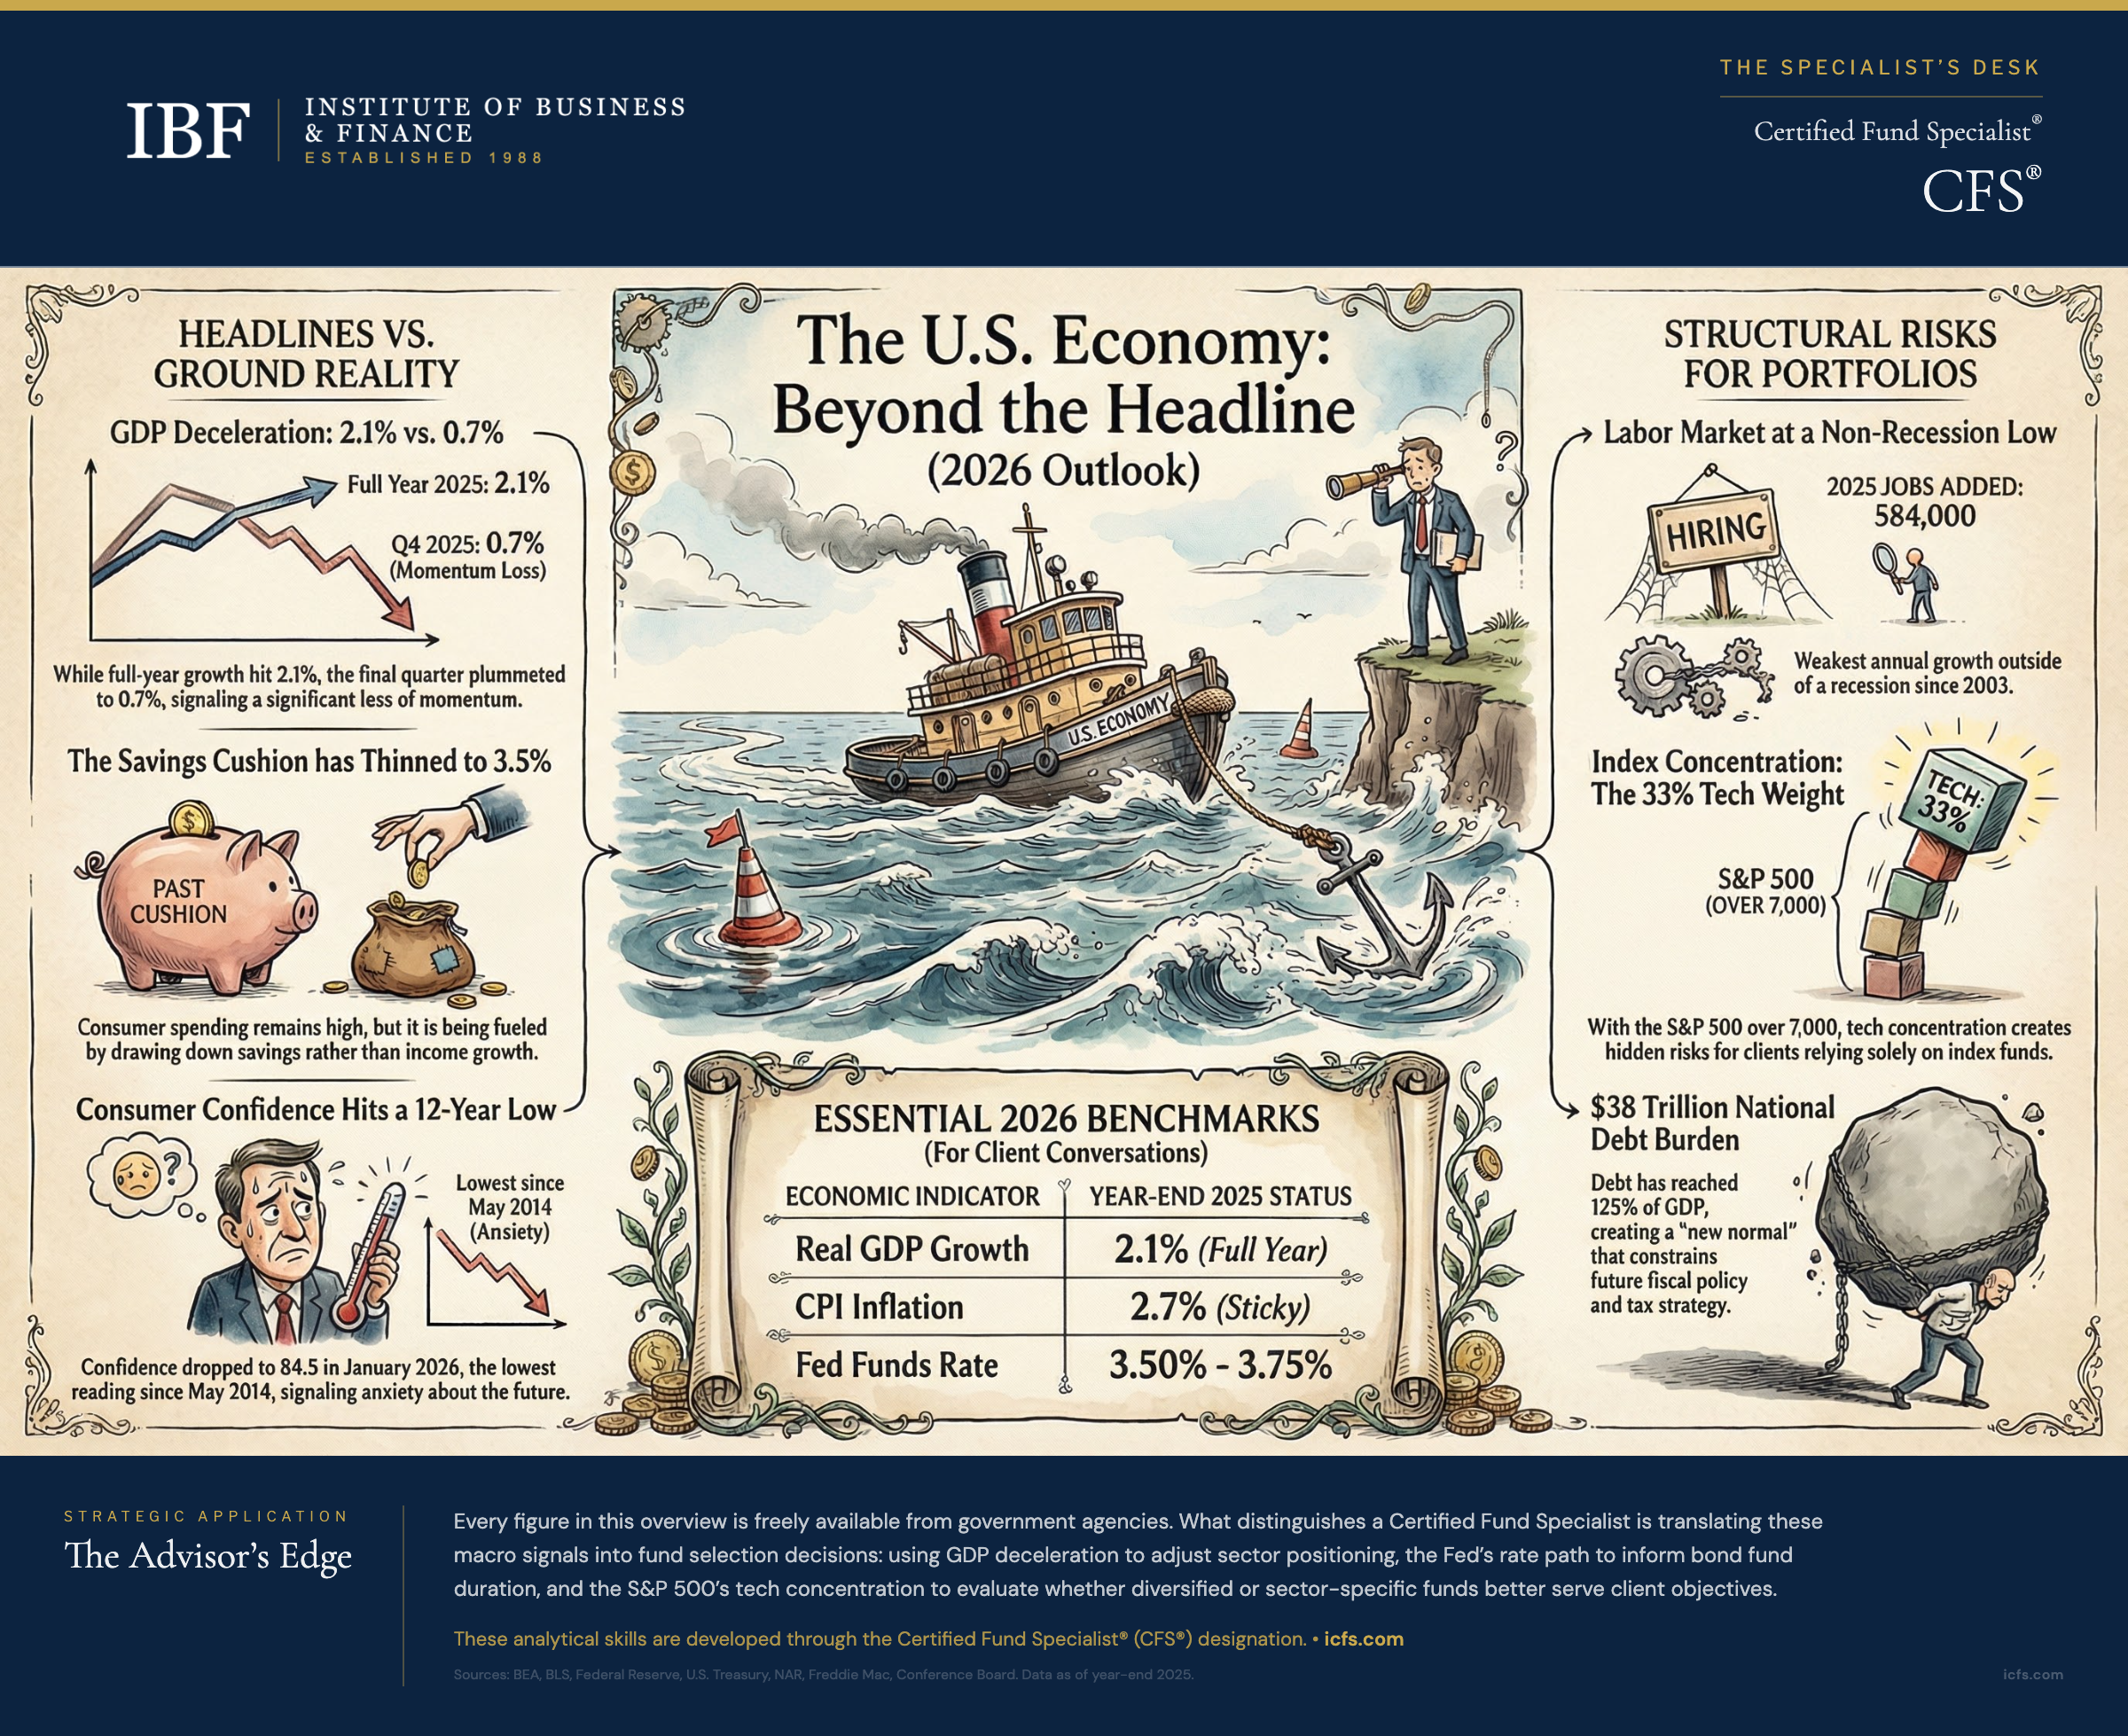
The U.S. economy grew 2.1% in real terms during 2025, a figure that reflects robust consumer spending offset by sharp deceleration in the final quarter. Q4 2025 came in at just 0.7% annualized, a sharp decline from 4.4% in Q3, with roughly 1 percentage point of that weakness attributable to federal government spending reductions. Consumer spending accounted for the vast majority of the year’s expansion, fueled by a personal savings rate that fell to 3.5%, the lowest annual figure in recent years. That combination (strong consumption on a thinning savings cushion, against a backdrop of $38 trillion in federal debt) tells a different story than the headline GDP number suggests. For advisors, the distinction matters: clients who see “economy grew 2.1%” in the news are forming expectations about their portfolios, their retirement timelines, and their risk tolerance based on a single number that obscures as much as it reveals.
This overview provides the current data across nine dimensions of the U.S. economy, with the context that makes each figure useful in practice. Every number here traces to a primary government source: the Bureau of Economic Analysis, the Bureau of Labor Statistics, the Federal Reserve, or the U.S. Treasury.
The U.S. Economy at a Glance
| Indicator | Value | Period | Source |
|---|---|---|---|
| Real GDP growth | 2.1% | Full year 2025 | BEA |
| Nominal GDP | ~$30.3 trillion | 2025 | BEA |
| Unemployment rate | 4.3% | January 2026 | BLS |
| Nonfarm payrolls added | +584,000 | Full year 2025 | BLS |
| CPI inflation (year-over-year) | 2.7% | December 2025 | BLS |
| Core CPI (ex-food and energy) | 2.6% | December 2025 | BLS |
| Federal funds rate | 3.50%-3.75% | Current (Dec 2025) | Federal Reserve |
| National debt | ~$38.0 trillion | Year-end 2025 | U.S. Treasury |
| Debt-to-GDP ratio | ~125% | FY 2025 | CBO/FRED |
| Annual federal deficit | $1.8 trillion | FY 2025 | CBO |
| Median existing home price | $405,400 | December 2025 | NAR |
| 30-year mortgage rate | 6.11% | February 2026 | Freddie Mac |
| S&P 500 | Crossed 7,000 | January 2026 | Market data |
| S&P 500 market capitalization | ~$62 trillion | January 2026 | GlobalData |
| Consumer confidence | 84.5 | January 2026 | Conference Board |
| Personal savings rate | 3.5% | November 2025 | BEA |
| Goods trade deficit | $1.24 trillion | Full year 2025 | BEA |
| Fed balance sheet | $6.5 trillion | December 2025 | Federal Reserve |
Output and Growth
The U.S. economy expanded at a 2.1% real rate in full-year 2025, down from 2.8% in 2024, a slowdown that signals a moderating growth environment but not yet a recessionary one. Growth in the first three quarters of 2025 was sufficient to put the full-year rate above the long-term trend of roughly 2%, but Q4 2025 dramatically decelerated to just 0.7% annualized (BEA second estimate), a sharp drop from the 4.4% pace in Q3. A significant portion of Q4’s weakness came from federal government spending, which subtracted roughly 1.0 percentage point from annualized growth, primarily due to the federal funding lapse. Nineteen of the 23 major industry groups contributed to 2025’s growth. Finance, insurance, real estate, and leasing remained the largest sector at approximately 21% of GDP. Consumer spending and private investment drove the year’s expansion, partly offset by decreases in government spending and net exports.
The price index for gross domestic purchases increased 2.6% in 2025, up from 2.4% in 2024, signaling a slight uptick in price pressures after a period of disinflation. For advisors building financial plans with inflation assumptions, the distinction between realized inflation and the planning tool defaults matters considerably: 2.6% actual versus the 3% or higher that many planning tools default to represents a substantial difference over 20- or 30-year projections. The uptick in 2025 suggests that assumption gap may be narrowing.
The Labor Market
The labor market in 2025 was weaker than most headlines conveyed. Total nonfarm payroll growth for the year came in at 584,000, the worst annual figure outside of a recession since 2003. The BLS annual benchmark revision, released in February 2026, further reduced prior months’ employment levels by approximately 898,000, making 2025 job growth even weaker than the headline figure suggests. January 2026 added 130,000 jobs, with gains concentrated in health care, social assistance, and construction.
The unemployment rate rose to 4.3% in January 2026, up from the sub-3.5% levels that characterized the tight labor market of 2022–2023. The labor force participation rate held at 62.5%, still below its pre-pandemic level and well below the 66–67% range that prevailed before the 2008 financial crisis. That structural decline in participation (driven primarily by an aging population and shifting workforce preferences) means the unemployment rate understates the degree to which the labor market has loosened.
Job openings, as measured by the JOLTS survey, fell to 6.5 million in December 2025 with an openings rate of 3.9%. That represents a significant cooling from the 12 million openings peak in early 2022. Quits held steady at 3.2 million, suggesting workers no longer feel the confidence to change jobs that characterized the “Great Resignation” period. Layoffs remained contained at 1.8 million.
The labor market data connects directly to two client conversations: retirement timing (clients nearing retirement in a softening job market may face different options than they anticipated) and income stability assumptions in financial plans that were built during the tight-labor-market years of 2022–2023.
Inflation and Monetary Policy
Consumer prices rose 2.7% year-over-year as of December 2025, with core inflation (excluding food and energy) at 2.6%. Both figures represent substantial progress from the 9.1% CPI peak in June 2022, but remain above the Federal Reserve’s 2% target.
The Federal Reserve responded to the disinflation trend by cutting the federal funds rate to a target range of 3.50%–3.75% at its December 2025 meeting, a quarter-point reduction. The Fed also concluded its quantitative tightening (QT) program in December 2025, ending a balance sheet reduction that had removed approximately $2.4 trillion in assets since June 2022. The Fed’s balance sheet stands at approximately $6.5 trillion, down from a pandemic peak of $8.9 trillion but still roughly eight times its pre-2008 size.
The interaction between rates, inflation, and the Fed’s balance sheet creates a dynamic that advisors encounter constantly in client conversations. Clients who lived through the zero-rate era of 2009–2021 formed expectations about borrowing costs, bond yields, and stock valuations that no longer apply. Clients who remember the high-rate era of the 1980s and 1990s may have different but equally outdated reference points. The current environment (moderate rates, declining but sticky inflation, a Fed that has pivoted but not aggressively) requires advisors to reframe client expectations around a “new normal” that resembles neither recent history.
Federal Debt and Fiscal Position
The U.S. national debt stands at approximately $38 trillion, with roughly $30.5 trillion held by the public and $7.5 trillion in intragovernmental holdings (primarily the Social Security and Medicare trust funds). The debt-to-GDP ratio has reached approximately 125%, a level that was nearly unthinkable outside of wartime a generation ago.
The annual federal deficit for fiscal year 2025 was $1.8 trillion, or 5.9% of GDP. Fiscal year 2024 (ending September 30, 2024) produced a $1.8 trillion deficit. These figures represent structural deficits: they persist during economic expansion, not because of recession-driven revenue declines or emergency spending. Interest payments on the debt now consume a growing share of federal revenue, creating a fiscal dynamic where the cost of existing debt constrains the government’s ability to respond to future economic shocks.
For client conversations, the debt picture matters in three concrete ways. First, the trajectory of tax policy is inseparable from the fiscal position. Tax rates, deduction limits, and estate tax thresholds all sit within a political debate that the debt level increasingly constrains. Second, Social Security and Medicare (funded partly through those intragovernmental holdings) face well-documented funding shortfalls that the broader fiscal picture makes harder to resolve. Third, the dollar’s role as the global reserve currency, which underpins the valuations of virtually every asset in a client’s portfolio, depends in part on global confidence in U.S. fiscal management.
Consumer Spending and Confidence
Personal consumption expenditures reached a $21.4 trillion annualized rate by November 2025, with monthly increases of 0.5% in both October and November. American consumers continued to spend, but the foundation supporting that spending has narrowed.
The personal savings rate fell to 3.5% by November 2025, well below the historical average and dramatically below the pandemic-era spike. The savings rate ranged from 3.5% to 4.7% through 2025, indicating that consumers were drawing down savings buffers rather than building them.
Consumer confidence, as measured by the Conference Board, dropped to 84.5 in January 2026, a decline of 9.7 points from December and the lowest reading since May 2014. The gap between present conditions (which consumers rated relatively well) and expectations (which collapsed) suggests growing anxiety about the economic outlook even as current spending holds.
This divergence between spending behavior and confidence readings is a pattern advisors should watch carefully. Consumers who are spending while feeling pessimistic are not in the same position as consumers who are spending because they feel optimistic. The former pattern tends to precede spending pullbacks, which ripple through corporate earnings, employment, and portfolio values.
Housing
The median existing home price reached $405,400 in December 2025, marking the 30th consecutive month of year-over-year price increases. Yet the volume tells a different story: existing home sales for 2025 remained near a 30-year low, stuck around 4 million units annually. December sales reached 4.35 million (seasonally adjusted annual rate), the fastest pace in nearly three years, but still far below the 5–6 million pace that characterized the pre-pandemic market.
The 30-year fixed mortgage rate stood at 6.11% in early February 2026, within a range of roughly 6.2% to 7.0% through most of 2025. For context, the rate bottomed near 2.65% in January 2021. The “lock-in effect” (homeowners who financed or refinanced at sub-4% rates choosing not to sell) continues to constrain supply, supporting prices even as affordability deteriorates for buyers.
Housing sits at the intersection of nearly every client conversation: retirement downsizing decisions, intergenerational wealth transfers, portfolio allocation (the home is often the largest single asset), and cash flow planning. The current dynamic of high prices with low transaction volume creates planning challenges that a single “median home price” figure does not capture.
Financial Markets
The S&P 500 crossed 7,000 for the first time in January 2026, with the index’s total market capitalization reaching approximately $62 trillion. Information technology companies accounted for approximately 33% of the index’s market cap, a concentration level that itself carries risk implications.
The market’s advance, while impressive in absolute terms, arrived against a backdrop of considerable volatility. Early February 2026 saw a three-day decline that erased nearly $1 trillion in market value and briefly pushed the index negative for the year. This kind of volatility is normal in historical context, but clients who have grown accustomed to predominantly upward markets since 2009 may experience even routine corrections as alarming.
The market’s current characteristics raise several planning considerations. The concentration of returns in a handful of mega-cap technology stocks means that a broad index fund is less diversified than many clients assume. Valuations, by most historical measures, remain elevated. And the relationship between equity returns and the economic fundamentals described throughout this article (slowing job growth, consumer confidence at decade lows, fiscal deficits) is looser than clients typically expect.
International Trade
The U.S. goods trade deficit reached $1,240.9 billion ($1.24 trillion) for full-year 2025, up $25.5 billion (2.1%) from 2024, reflecting the structural reality that the U.S. consumes more goods from the rest of the world than it exports. The goods and services combined deficit totaled $901.5 billion in 2025. Monthly figures through 2025 demonstrated significant volatility, and this volatility pattern is worth noting by advisors: trade data can swing considerably month-to-month due to timing of shipments, inventory adjustments, and seasonal factors, making any single monthly figure misleading as a trend indicator.
The top trading partners by total goods value in 2024 were the European Union ($976 billion), Mexico ($840 billion), Canada ($762 billion), China ($582 billion), and Japan ($228 billion). The largest bilateral deficits were with China ($295 billion), Mexico ($172 billion), and Vietnam ($123 billion).
Trade policy remains a source of uncertainty that affects client portfolios through multiple channels: tariff impacts on corporate margins, currency effects on international holdings, and supply chain disruptions that affect specific sectors and companies. Anyone advising clients who hold international funds, multinational equities, or sector-specific positions need the trade context to explain performance patterns that may not be obvious from domestic data alone.
Where the Numbers Fall Short
No collection of economic indicators, however current, captures the full picture. Several limitations are worth keeping in mind.
GDP measures economic output, not economic well-being. An economy can grow while median household income stagnates, wealth inequality widens, or environmental costs accumulate. The 2.1% growth figure says nothing about how that growth was distributed.
The unemployment rate counts people who are actively looking for work. It does not count discouraged workers who have stopped searching, underemployed workers who want full-time positions, or the labor force participation decline that represents millions of working-age adults who are not in the workforce at all. The 4.3% rate is a useful benchmark, but it paints a rosier picture than the full employment situation warrants.
Inflation metrics aggregate thousands of prices into a single number. The CPI’s 2.7% figure may bear little resemblance to what a particular client experiences. Housing costs, health care, and education (categories that weigh heavily on many households) have inflated at rates well above the headline number. A retiree in a paid-off home experiences a different “personal inflation rate” than a young family with a mortgage and childcare expenses.
National debt figures are often quoted without the context of who holds the debt, what assets back it, or how the cost of servicing it compares to federal revenue. A $38 trillion number sounds alarming. Whether it is alarming depends on interest rates, GDP growth, and the composition of the debt, all of which require more context than the headline figure provides.
These limitations do not make the data useless. They make it a starting point rather than a conclusion. The advisor’s role is to translate the data into the specific context of each client’s situation, which requires understanding both what the numbers say and what they leave out.
Key Takeaways
- GDP decelerated from 2.8% in 2024 to 2.1% in 2025, with Q4 slowing sharply to 0.7% annualized. This deceleration pattern affects fund allocation timing: growth-oriented funds face different market dynamics in a slowing economy than in an expanding one.
- Consumer spending drove 2025 growth while the savings rate fell to 3.5%, the lowest sustained level in recent years. This combination signals sustainability risk for equity-heavy portfolios if consumer spending pulls back.
- The Federal Reserve cut rates to 3.50%–3.75% in December 2025 and ended quantitative tightening, with the balance sheet holding at $6.5 trillion. This policy path directly affects bond fund duration positioning and yield curve strategy.
- The S&P 500 crossed 7,000 with information technology companies representing roughly one-third of the index’s market capitalization. This concentration creates significant portfolio risk for advisors relying solely on index funds.
- The labor market added only 584,000 jobs in 2025, the worst non-recession annual figure since 2003, while consumer confidence dropped to 84.5 in January 2026, its lowest level since May 2014. This divergence between labor market weakness and continued spending creates sector rotation opportunities and risks.
- Consumer confidence fell dramatically while spending continued, signaling a behavioral gap advisors must address. Consumers confident in an improving economy behave differently from consumers spending defensively with pessimistic expectations.
The Advisor’s Edge
Every figure in this article is freely available from government agencies and financial data providers. Any client with an internet connection can find the GDP growth rate, the unemployment rate, or the S&P 500 level.
What distinguishes a Certified Fund Specialist is the ability to translate this macro data into fund selection decisions. A fund specialist uses GDP deceleration signals to adjust sector fund positioning, understanding that a moderating growth environment requires different equity fund allocations than an accelerating one. The Fed’s rate-cutting trajectory directly informs bond fund duration and maturity decisions: lower rates typically extend duration, and specialists must position bond fund portfolios accordingly. When the S&P 500’s heavy technology concentration creates portfolio risk, it is the specialist’s job to evaluate whether diversified or sector-specific funds better serve client objectives. When consumer savings collapse while consumer spending continues, that signals both fund flow patterns (which affect liquidity and performance) and the behavioral gap that fund-selection strategies can address.
The Certified Fund Specialist designation builds this practitioner-level competency in translating economic data, market conditions, and fund structure into coherent portfolio strategies that transform publicly available information into professional value.
For additional context on fund industry dynamics, see Financial Facts and Statistics Every Advisor Should Know.
Sources and Notes: GDP data from the Bureau of Economic Analysis (Q4 2025 Second Estimate). Employment data from the Bureau of Labor Statistics (Employment Situation Summary, JOLTS). Inflation data from BLS (Consumer Price Index). Federal funds rate and balance sheet data from the Federal Reserve Board. National debt and deficit data from the U.S. Treasury and Congressional Budget Office. Consumer spending and savings from BEA (Personal Income and Outlays). Housing data from the National Association of Realtors and Freddie Mac. Market data from GlobalData and financial market sources. Consumer confidence from the Conference Board. Trade data from BEA and U.S. Census Bureau. This article is refreshed annually with year-end data, typically in January or February.